
Ski Season Forecast
Ski Season Forecast
National Oceanic and Atmospheric Administration’s Climate Prediction Center produces long-range generalized climate forecasts based on the average of seven different General Circulation Model simulations. These forecasts are released on the 8th day of every month with predictions of temperature and precipitation patterns over North America for the next seven months. The correctness of these forecasts becomes less with lead time. For this reason only three months are shown. The skill of these forecasts are better for temperature compared to precipitation, and are particularly good for temperature during winter and spring when El Niño or La Niña events are occurring. Finally, these forecasts are generally poor during neutral ENSO years (El Niño or La Niña are not occurring).
The predictions for each month describe the anomaly from the 1991 to 2020 average. Prediction maps for temperature and precipitation for the next 3 months are shown below. Also shown is the forecast for the current month from the previous model run release.
Temperature Forecast
For September, the long-range forecast suggests temperatures will be about 1 to 2°C warmer than normal in British Columbia and western Alberta, according to NOAA’s Climate Prediction Center.
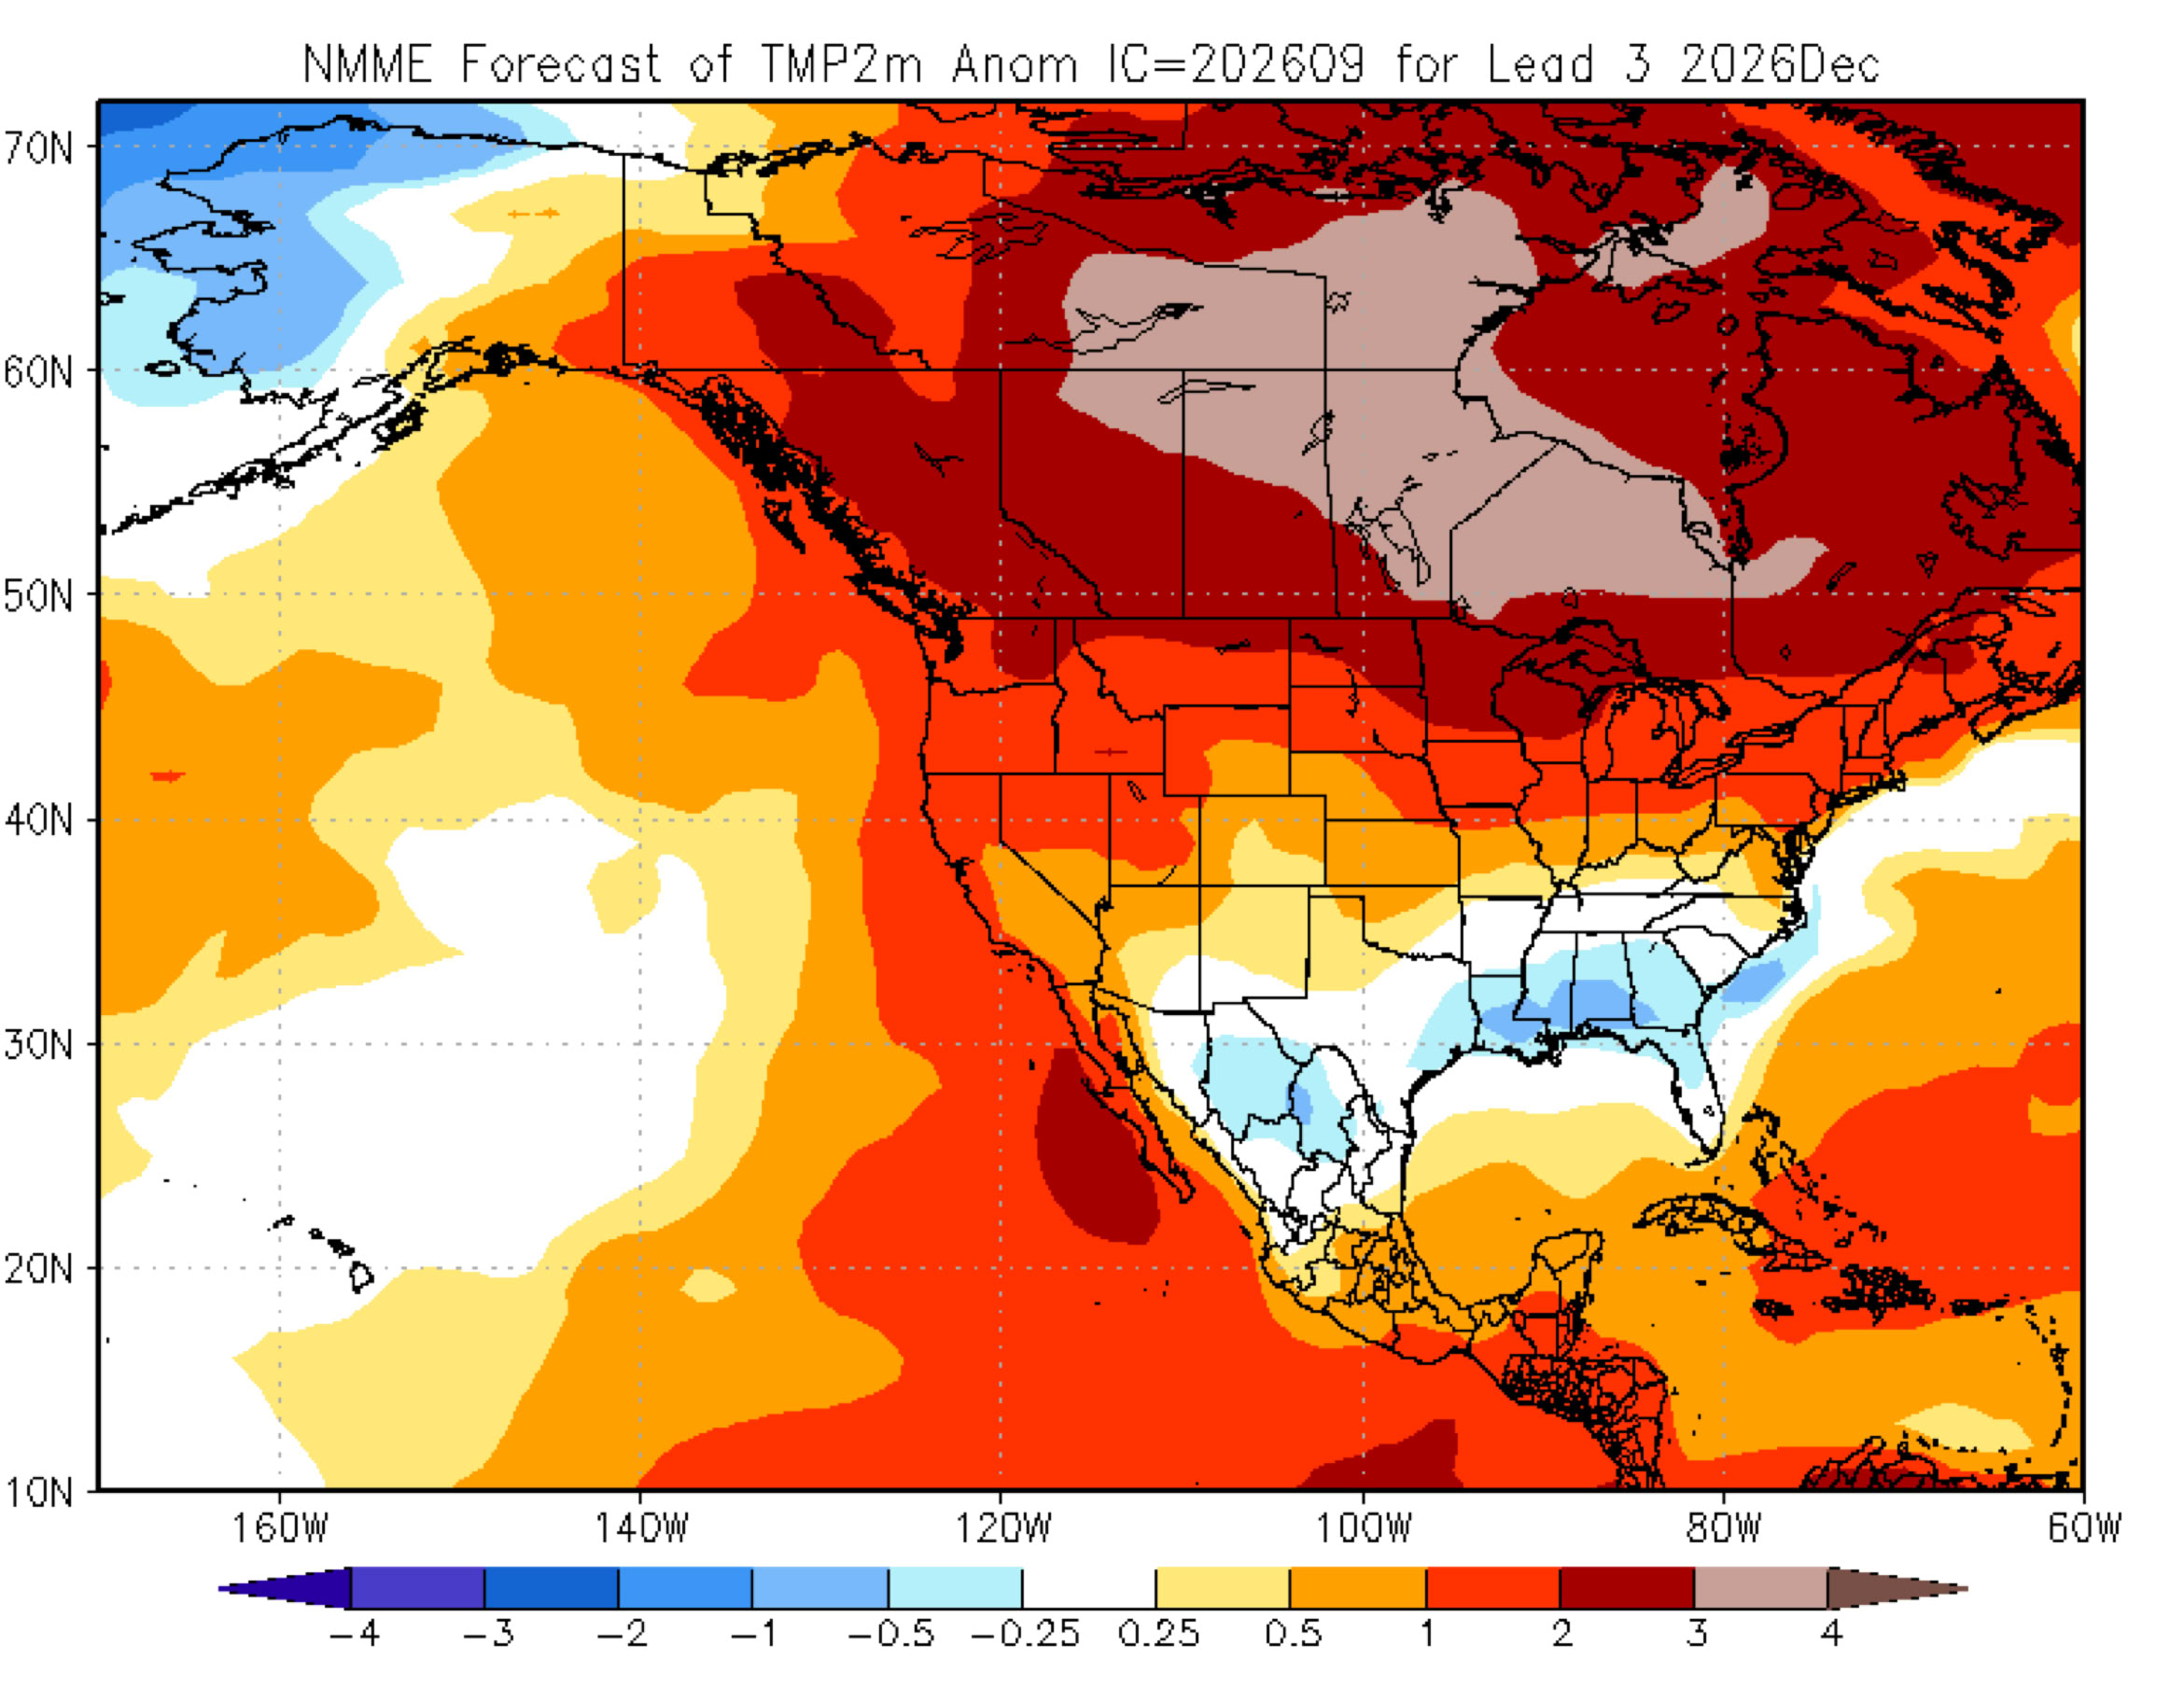
Above-normal temperatures will continue into the months of October and November. In December, temperatures will be about 2 to 3°C warmer than normal in central British Columbia and western Alberta. Coastal areas of British Columbia will be about 1 to 2°C warmer than normal.
Precipitation Forecast
For September, the forecast suggests precipitation will be below-normal in all of British Columbia and approach normal in western Alberta, according to NOAA’s Climate Prediction Center.
The below-normal precipitation pattern will intensify in southern British Columbia and extend into western Alberta in October and November.
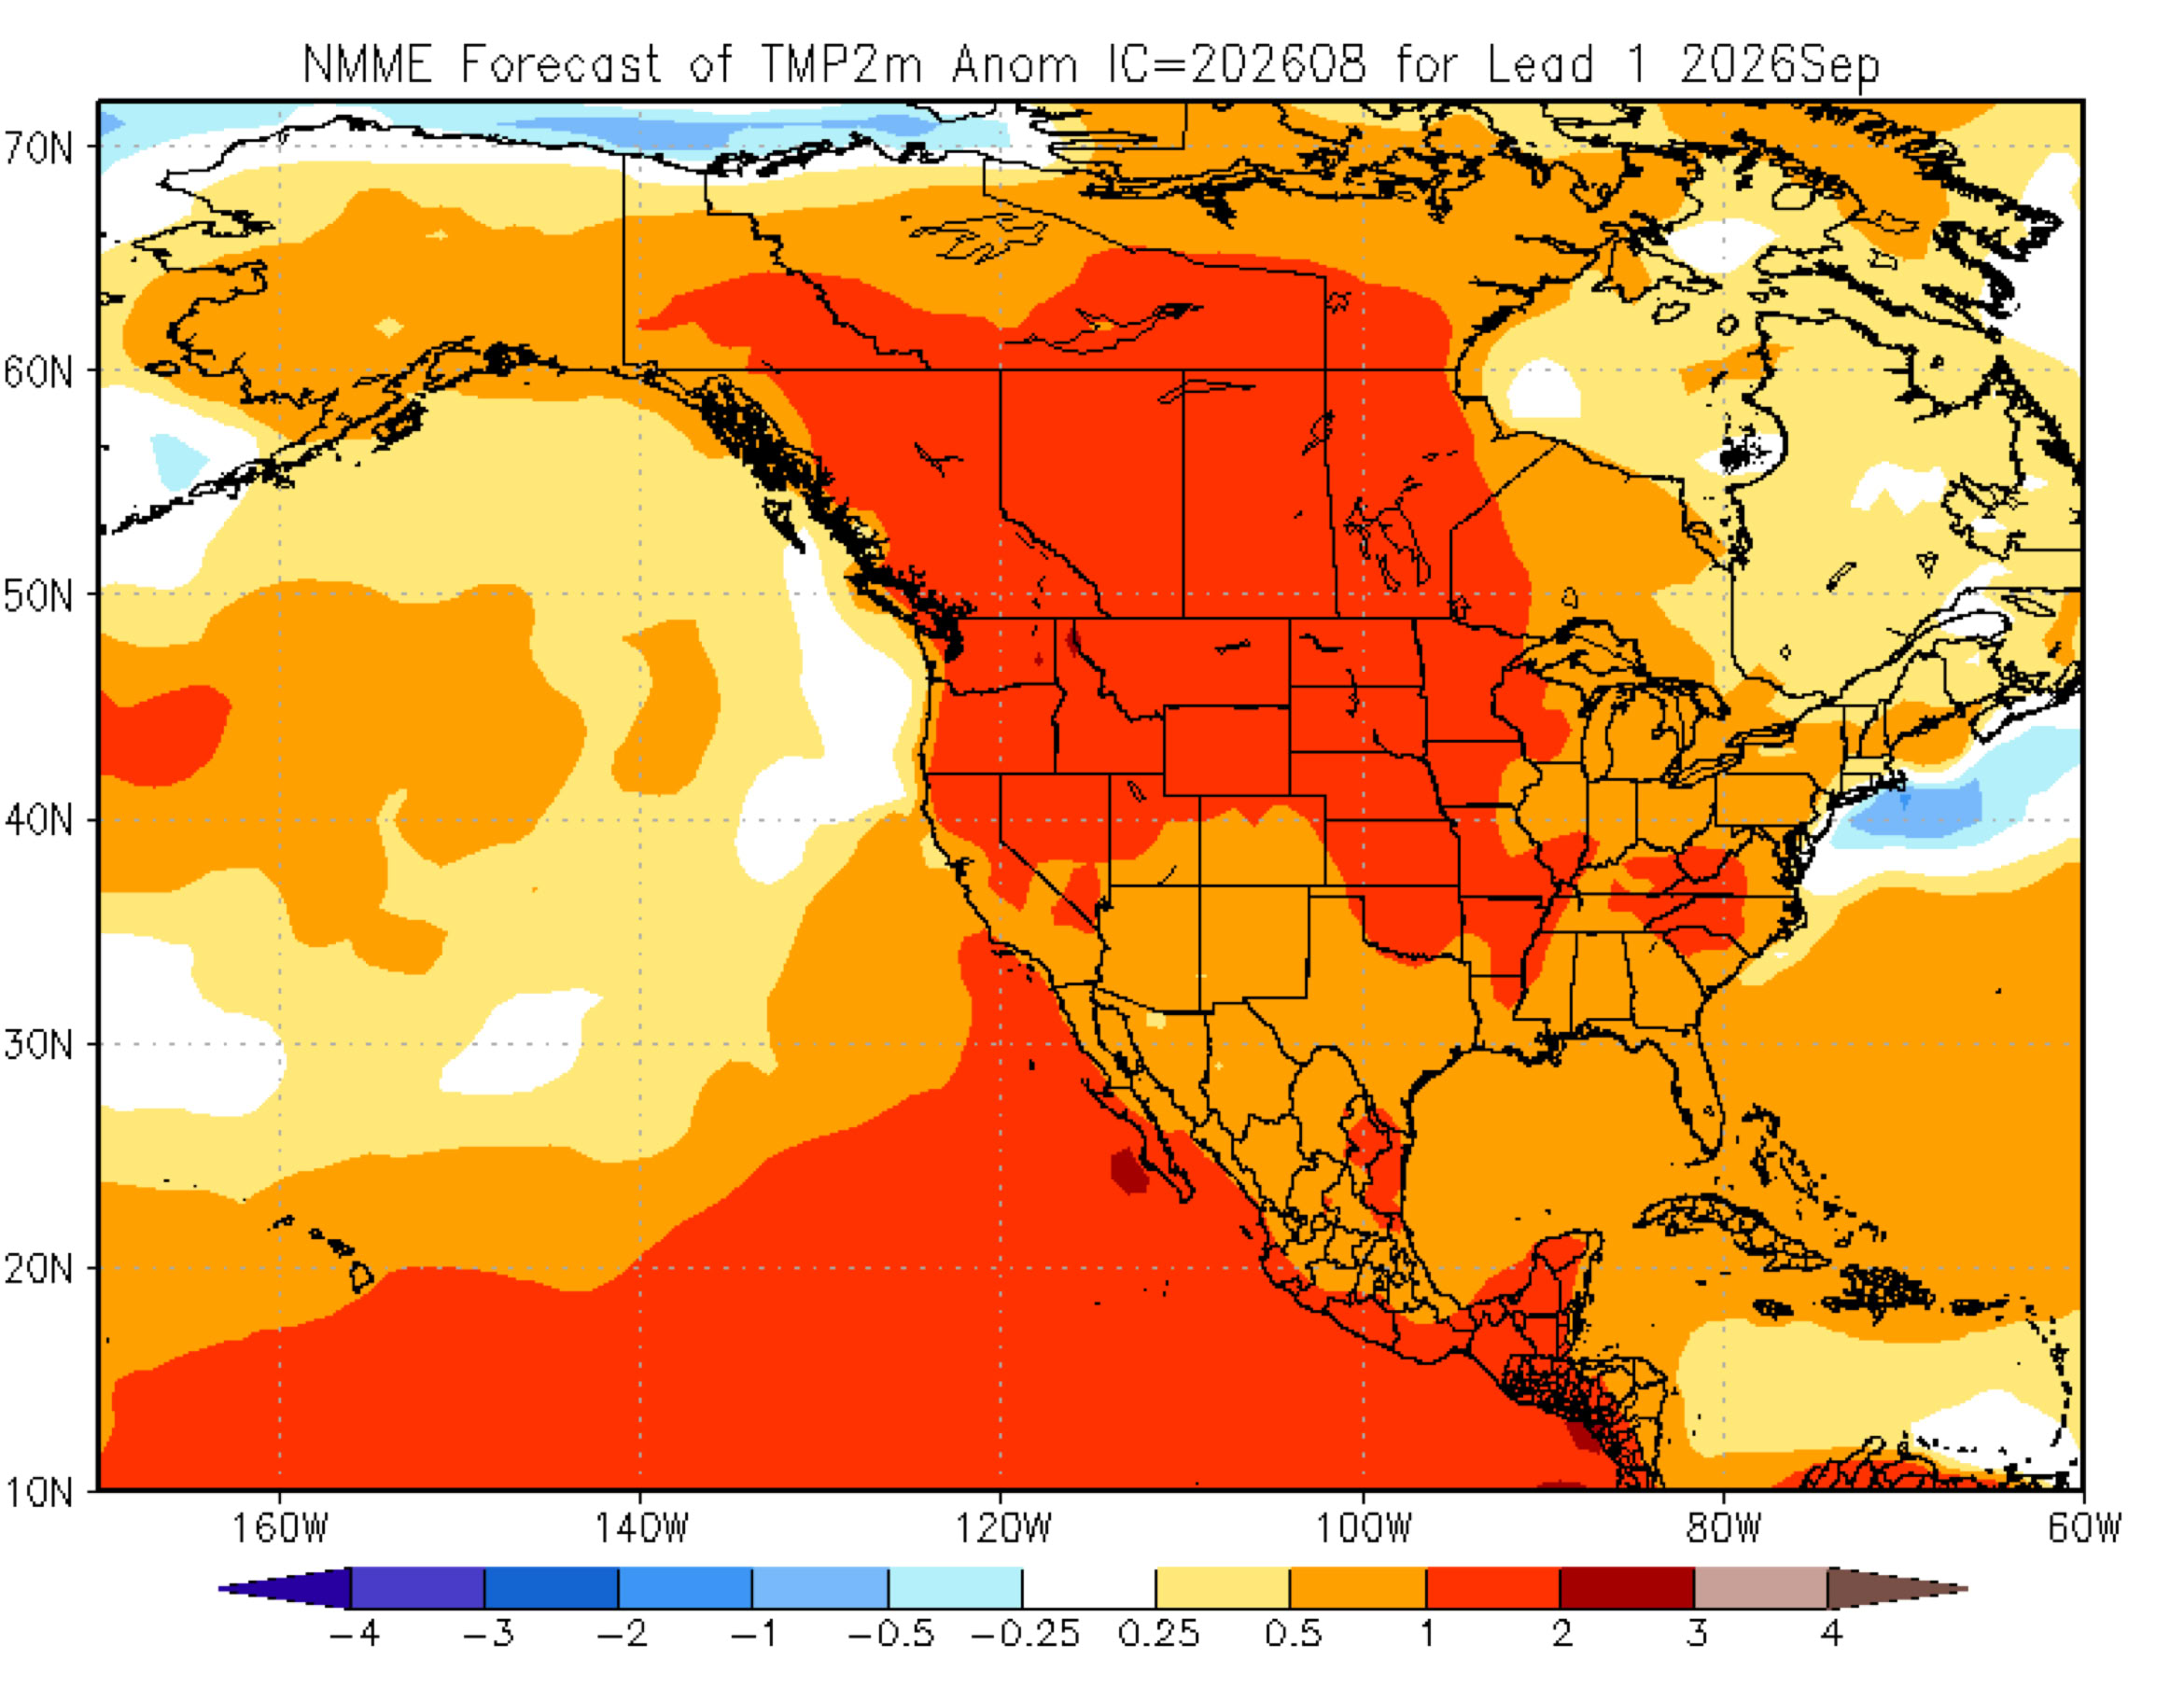
Figure 2 Climate Prediction Center – North American Multi-Model Ensemble temperature forecast for October 2026. September 2026 model run. Shown is the forecasted temperature anomaly relative to the 1991 to 2020 thirty-year average.
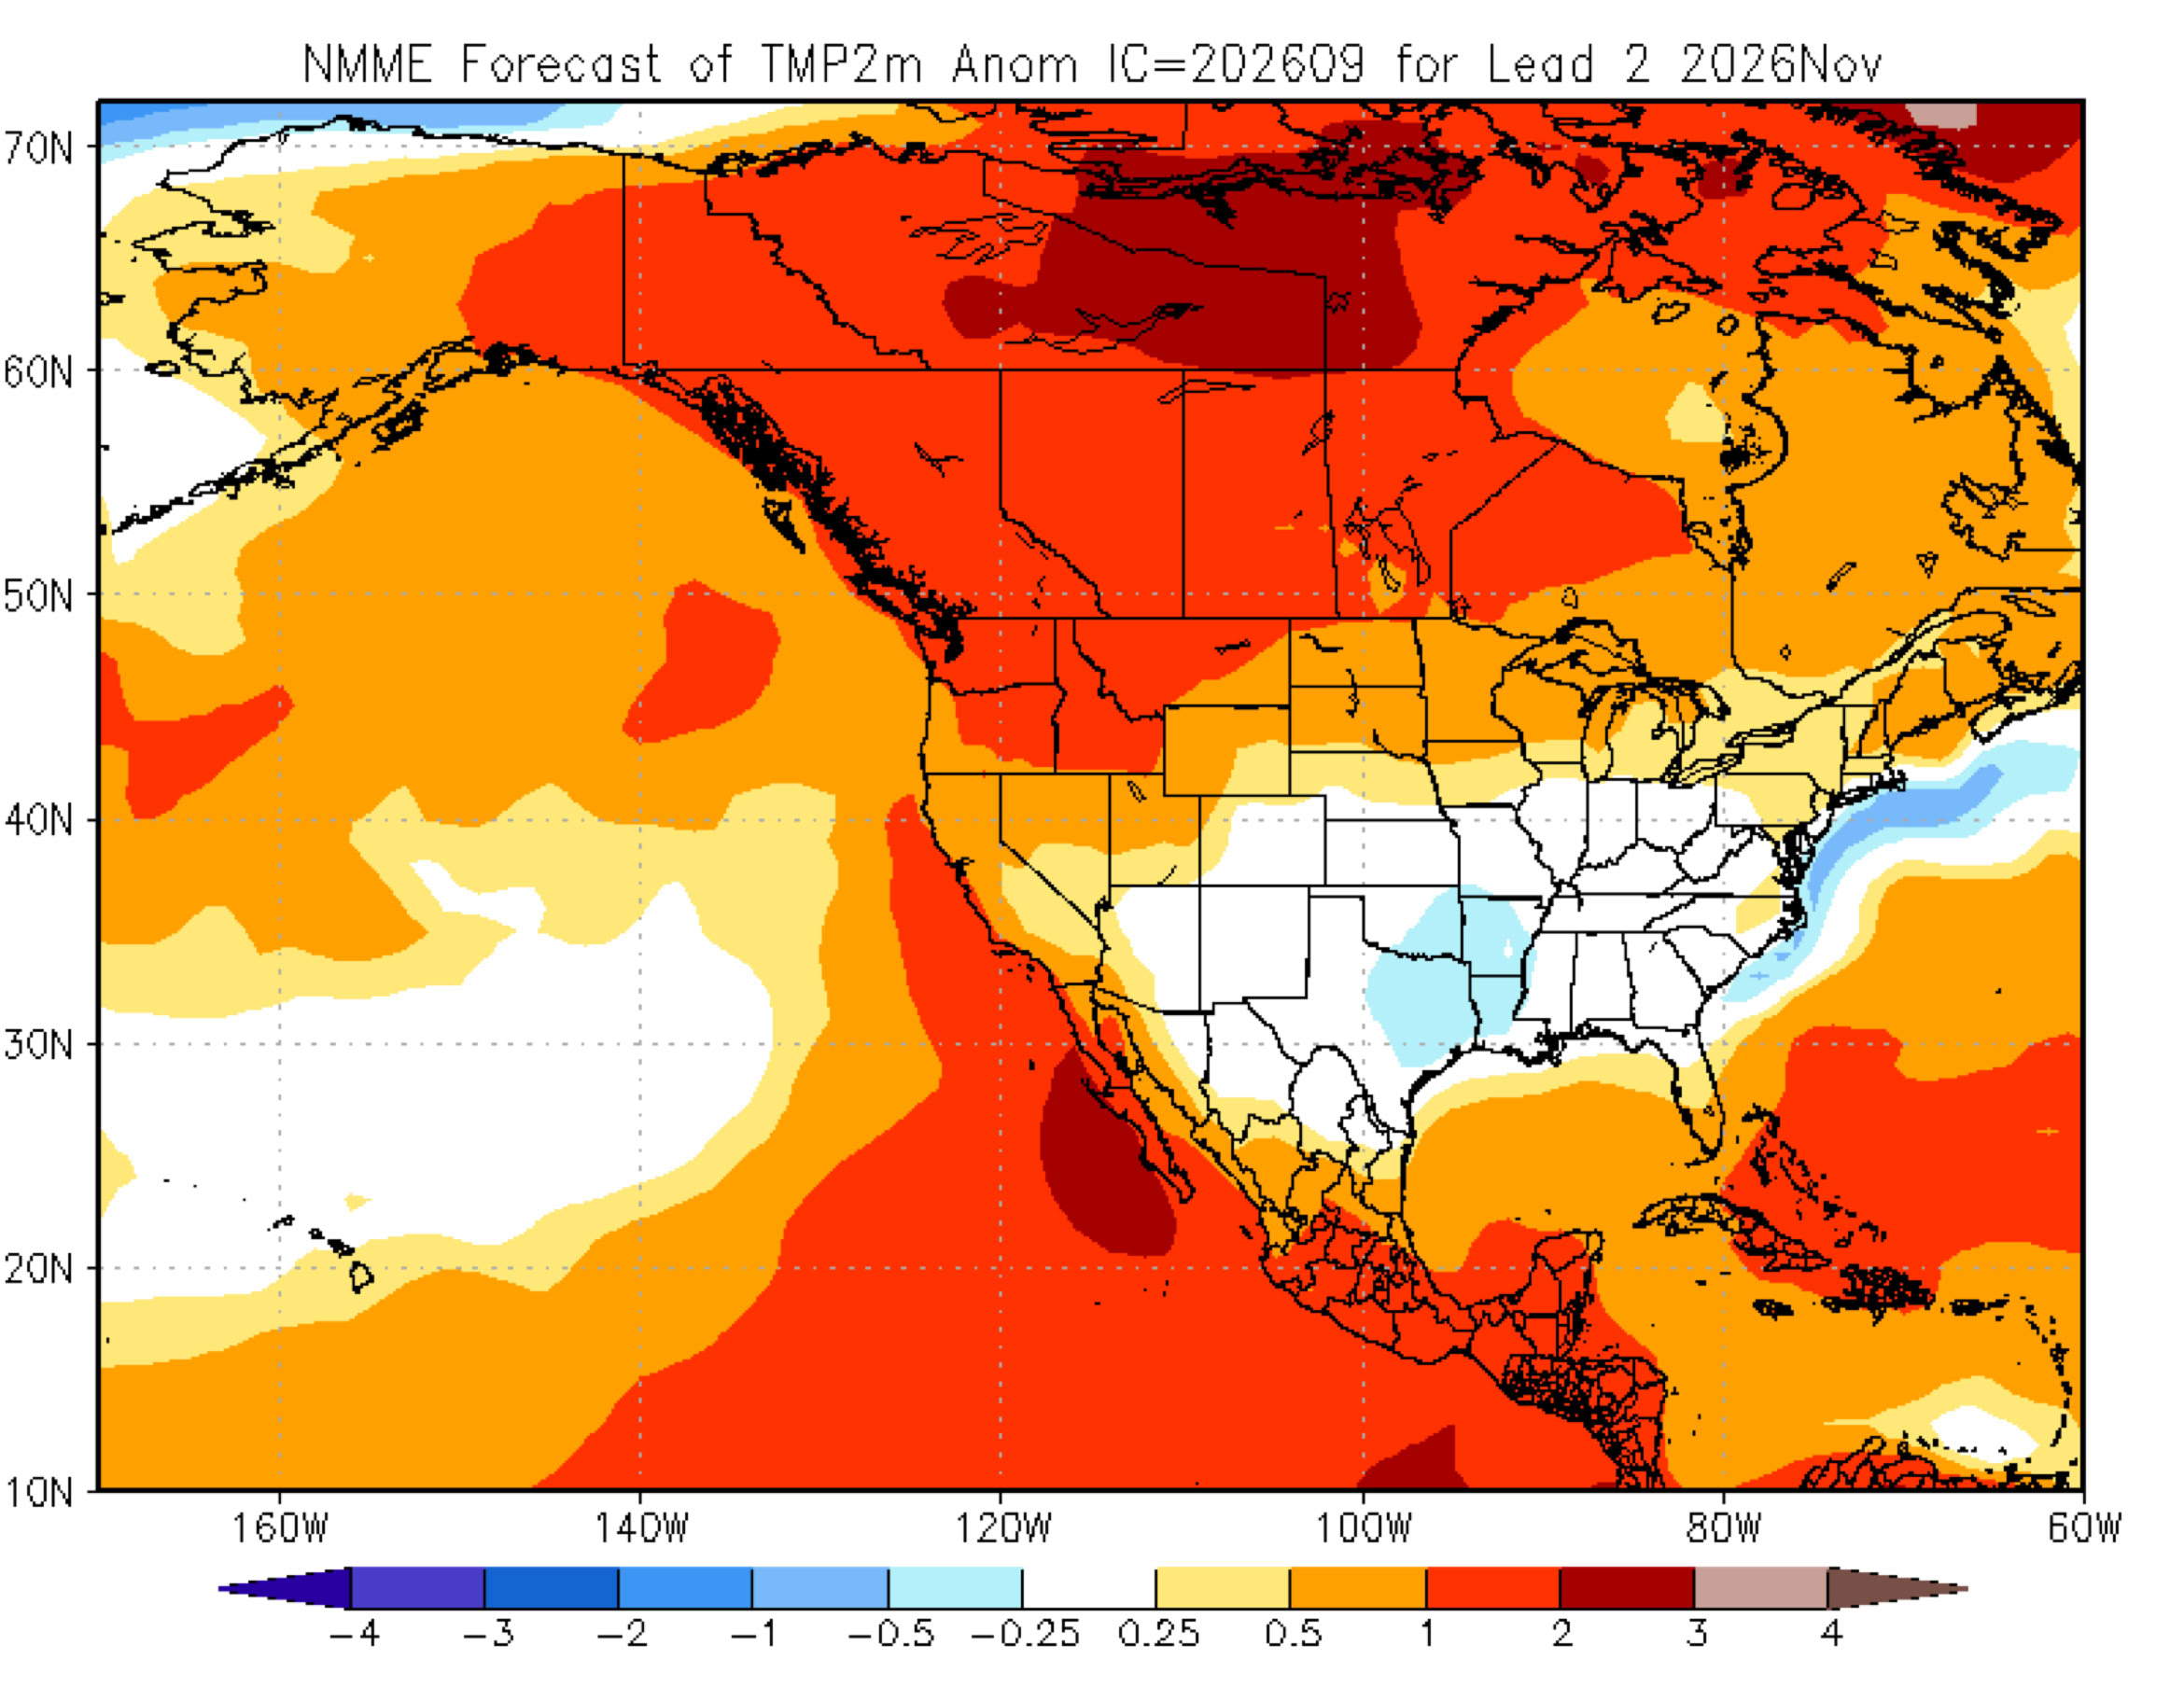
Figure 5 Climate Prediction Center – North American Multi-Model Ensemble precipitation forecast for September 2026. August 2026 model run. Shown is the forecasted precipitation anomaly relative to the 1991 to 2020 thirty-year average.
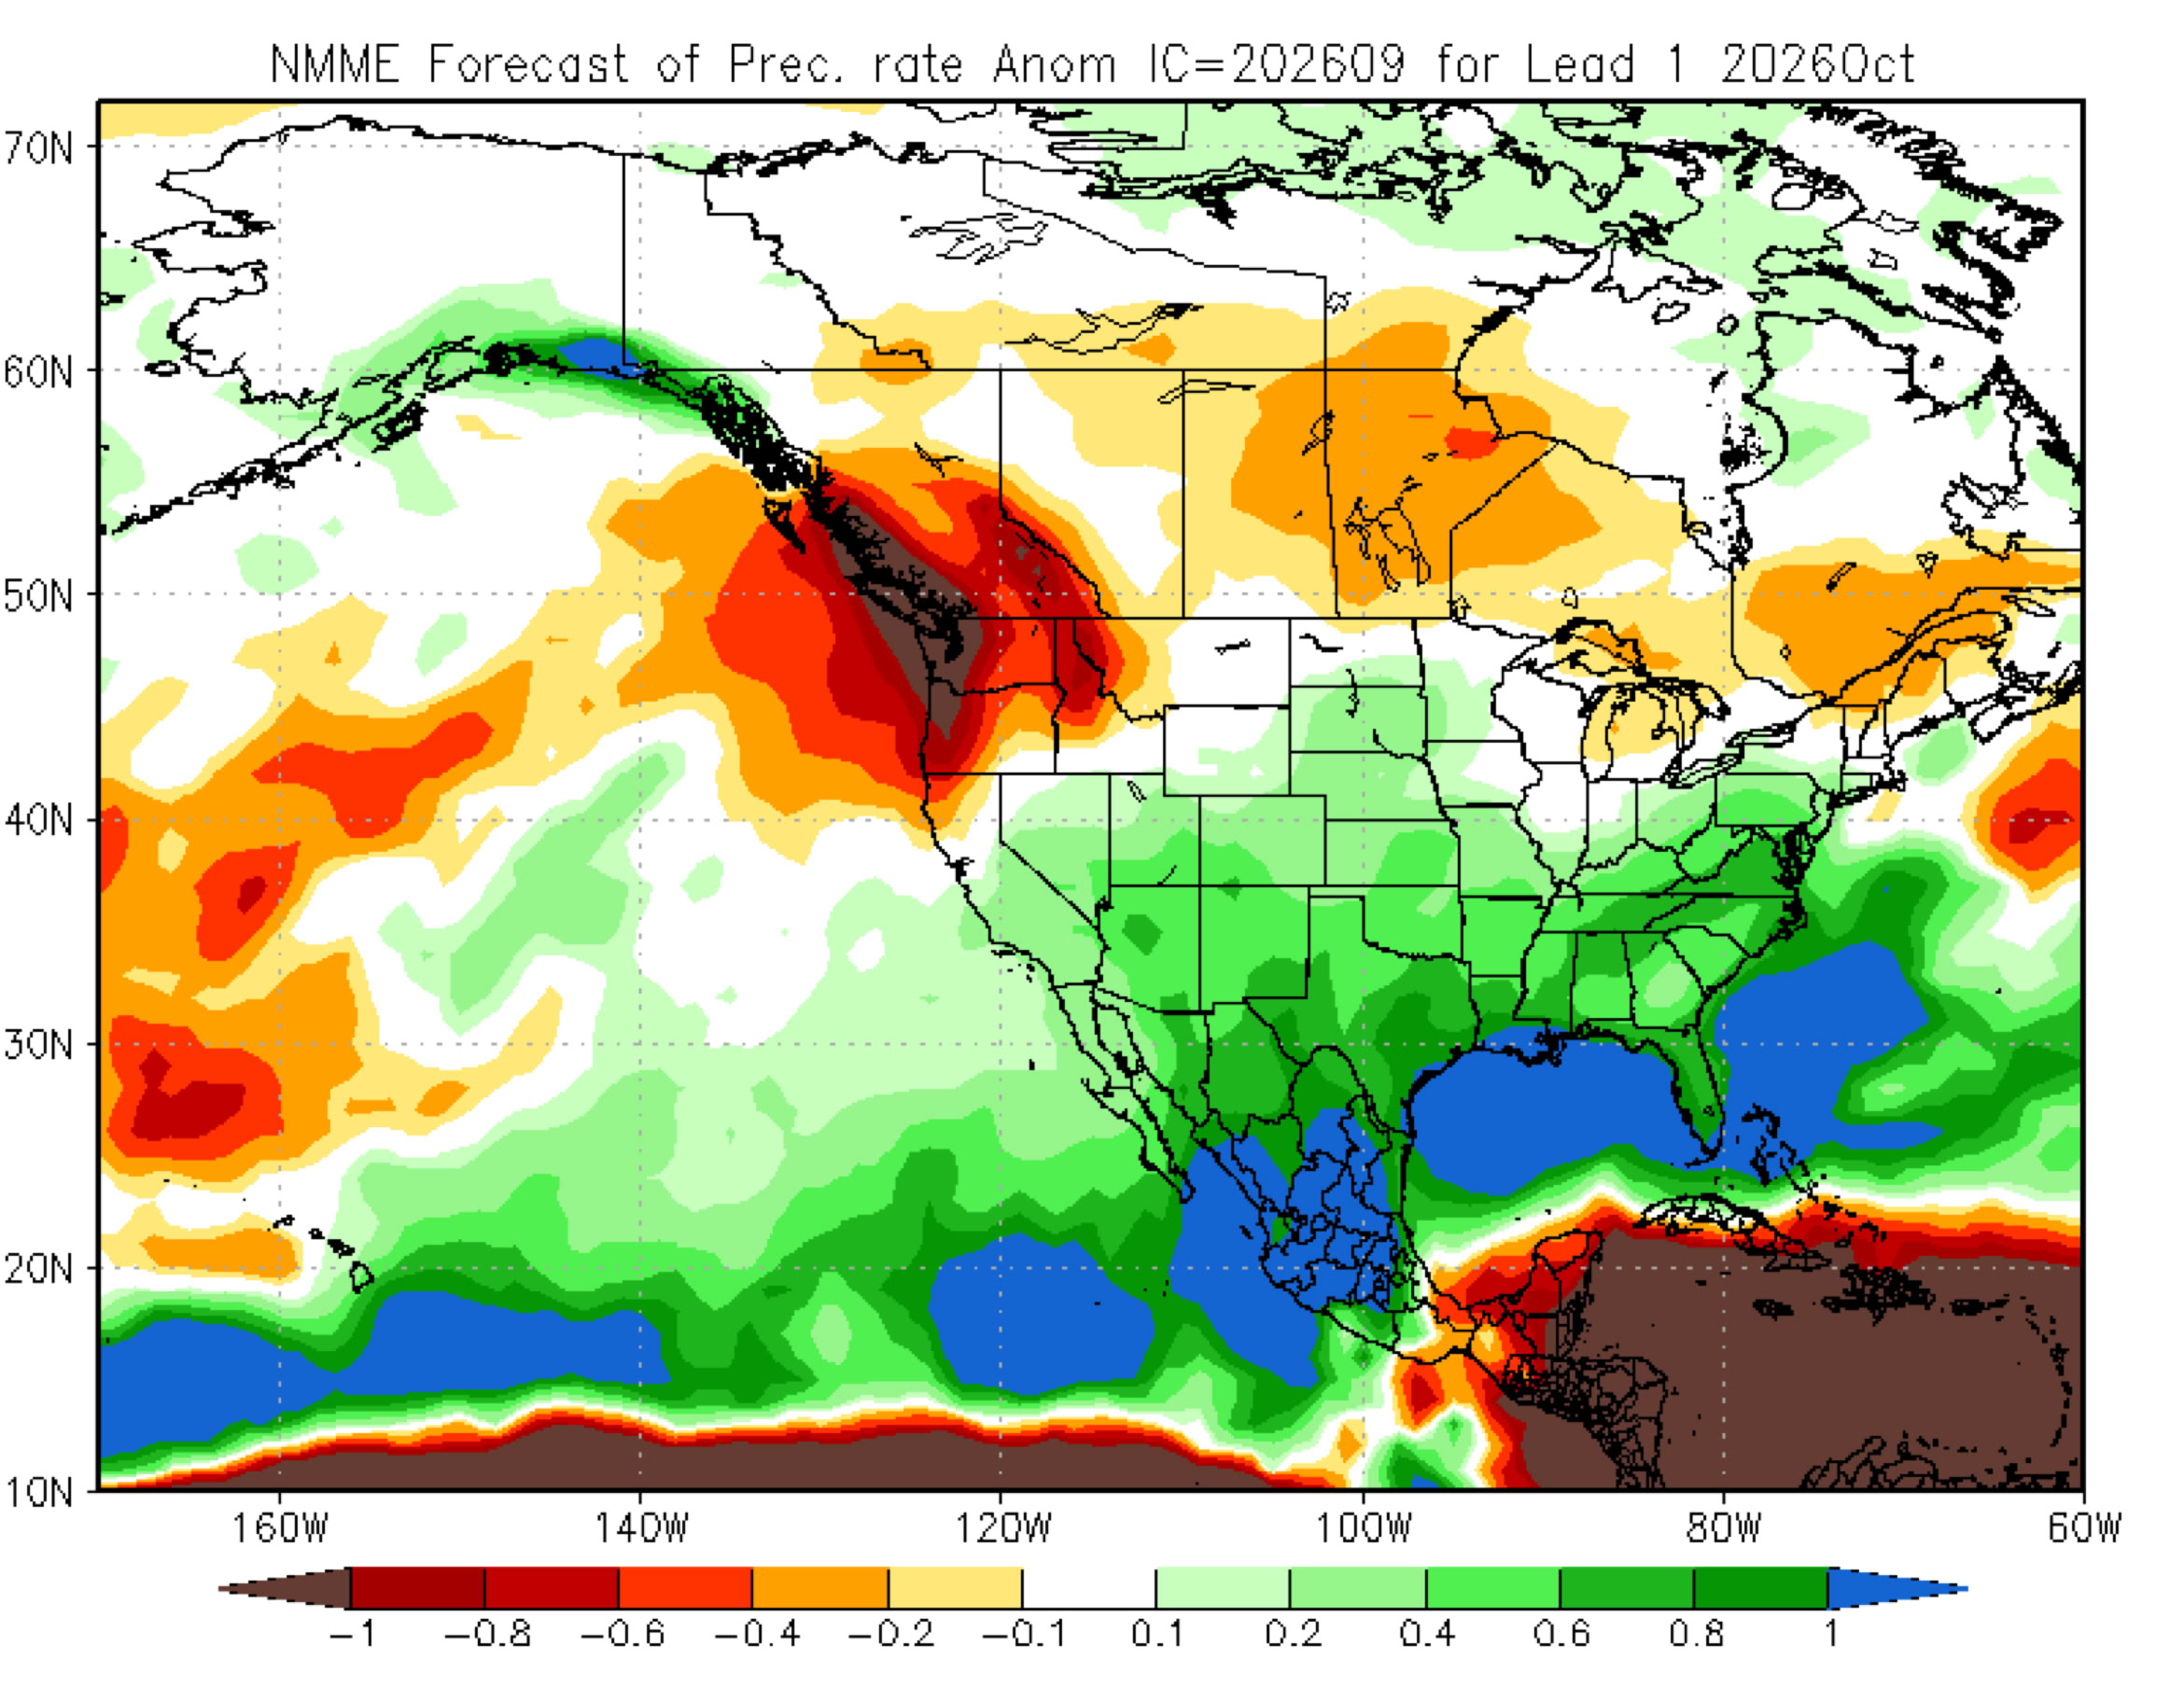
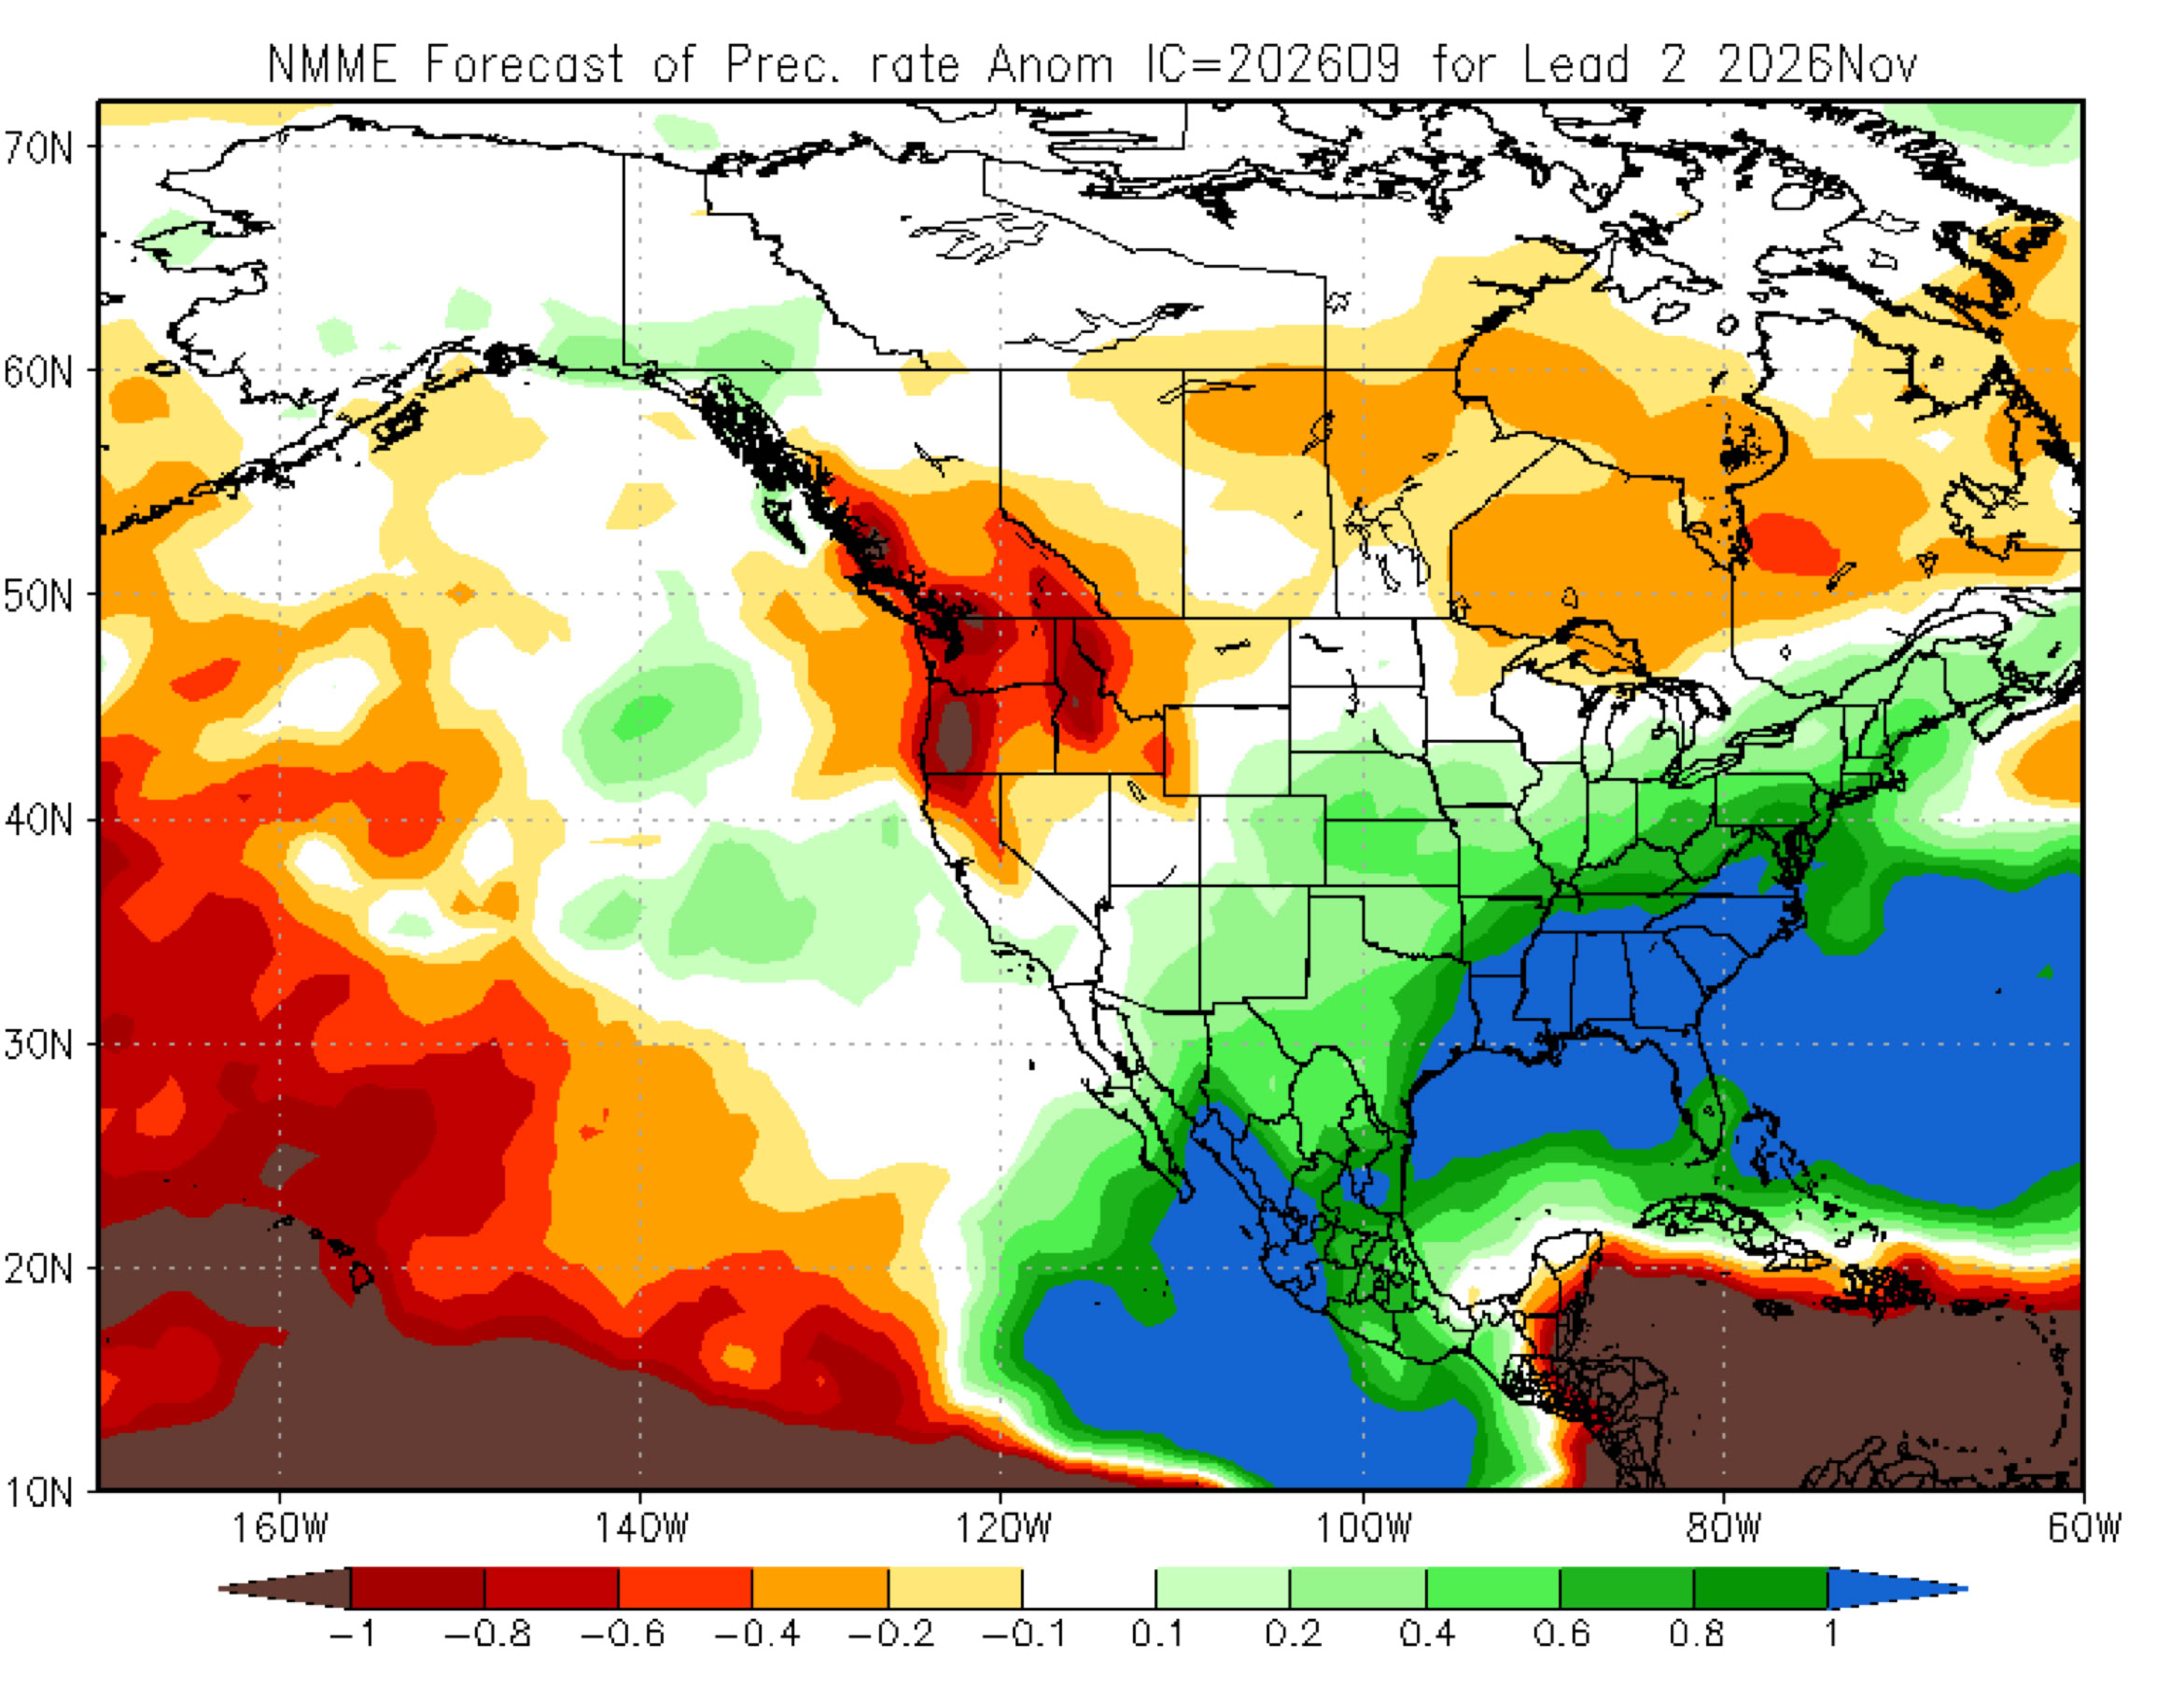
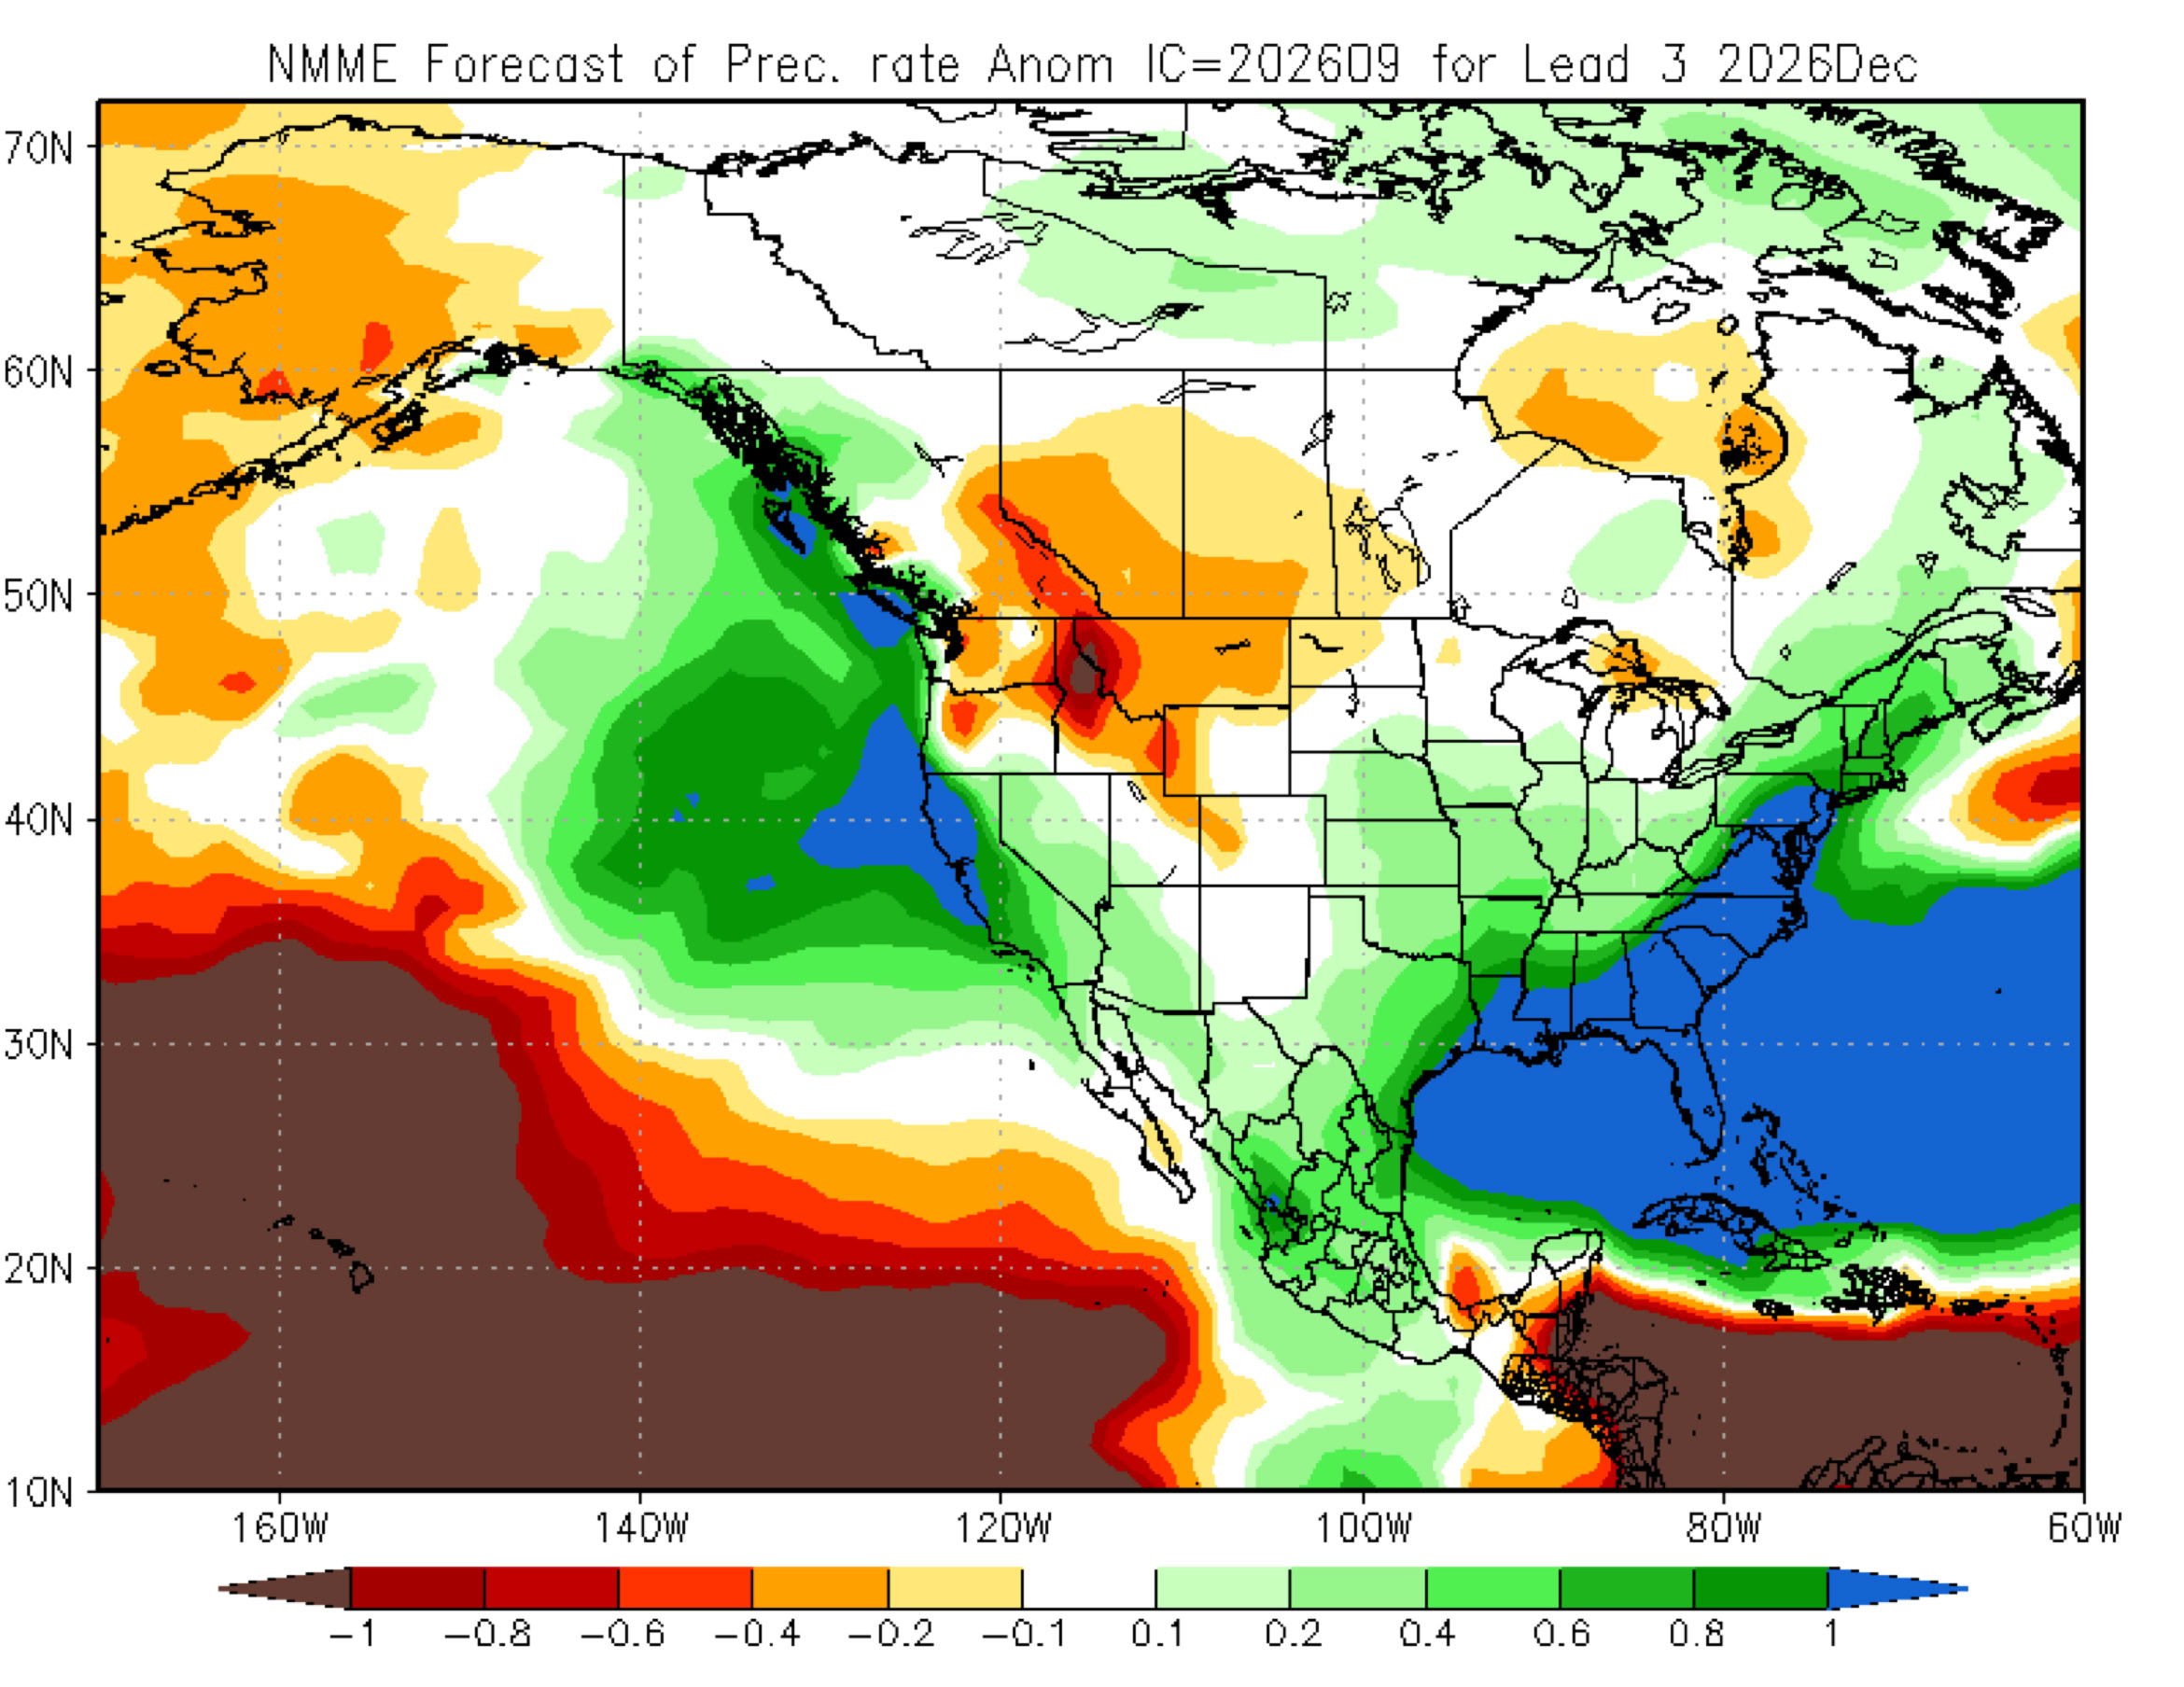
Figure 8 Climate Prediction Center – North American Multi-Model Ensemble precipitation forecast for December 2027. September 2026 model run. Shown is the forecasted precipitation anomaly relative to the 1991 to 2020 thirty-year average.
Figure 1 Climate Prediction Center – North American Multi-Model Ensemble temperature forecast for September 2026. August 2026 model run. Shown is the forecasted temperature anomaly relative to the 1991 to 2020 thirty-year average.
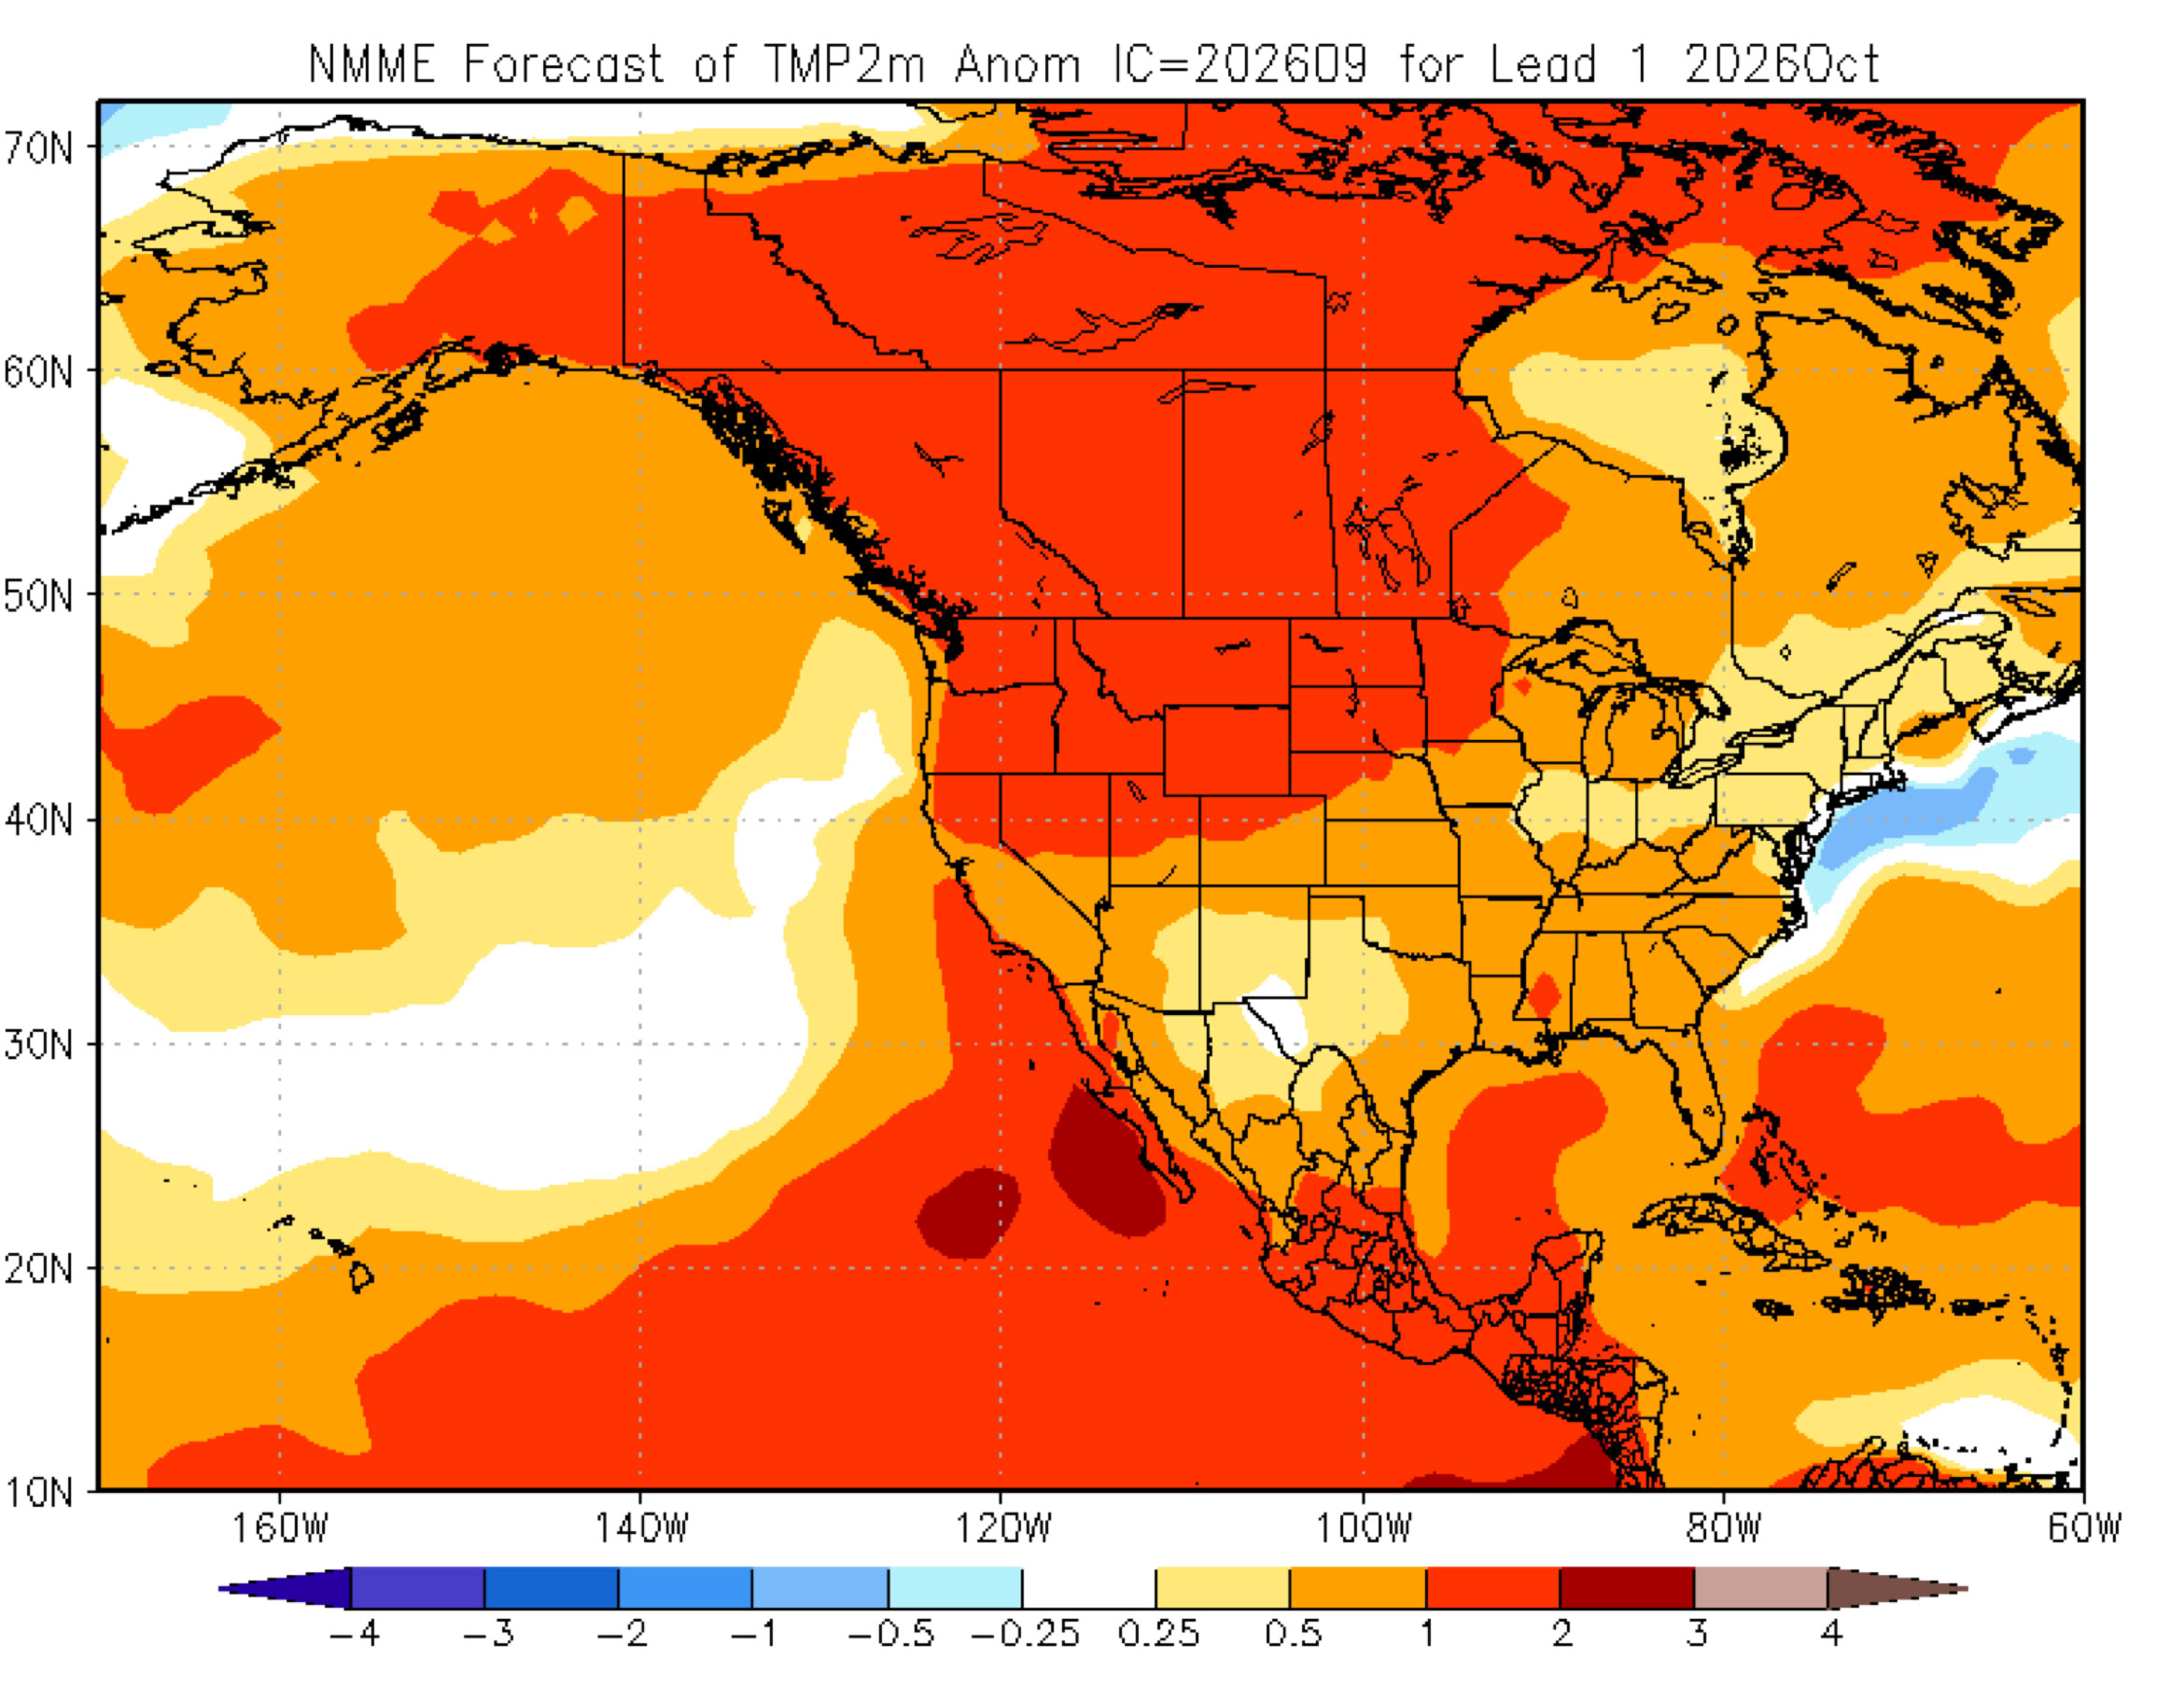
Figure 3 Climate Prediction Center – North American Multi-Model Ensemble temperature forecast for November 2027. September 2026 model run. Shown is the forecasted temperature anomaly relative to the 1991 to 2020 thirty-year average.
Figure 4 Climate Prediction Center – North American Multi-Model Ensemble temperature forecast for December 2027. September 2026 model run. Shown is the forecasted temperature anomaly relative to the 1991 to 2020 thirty-year average.
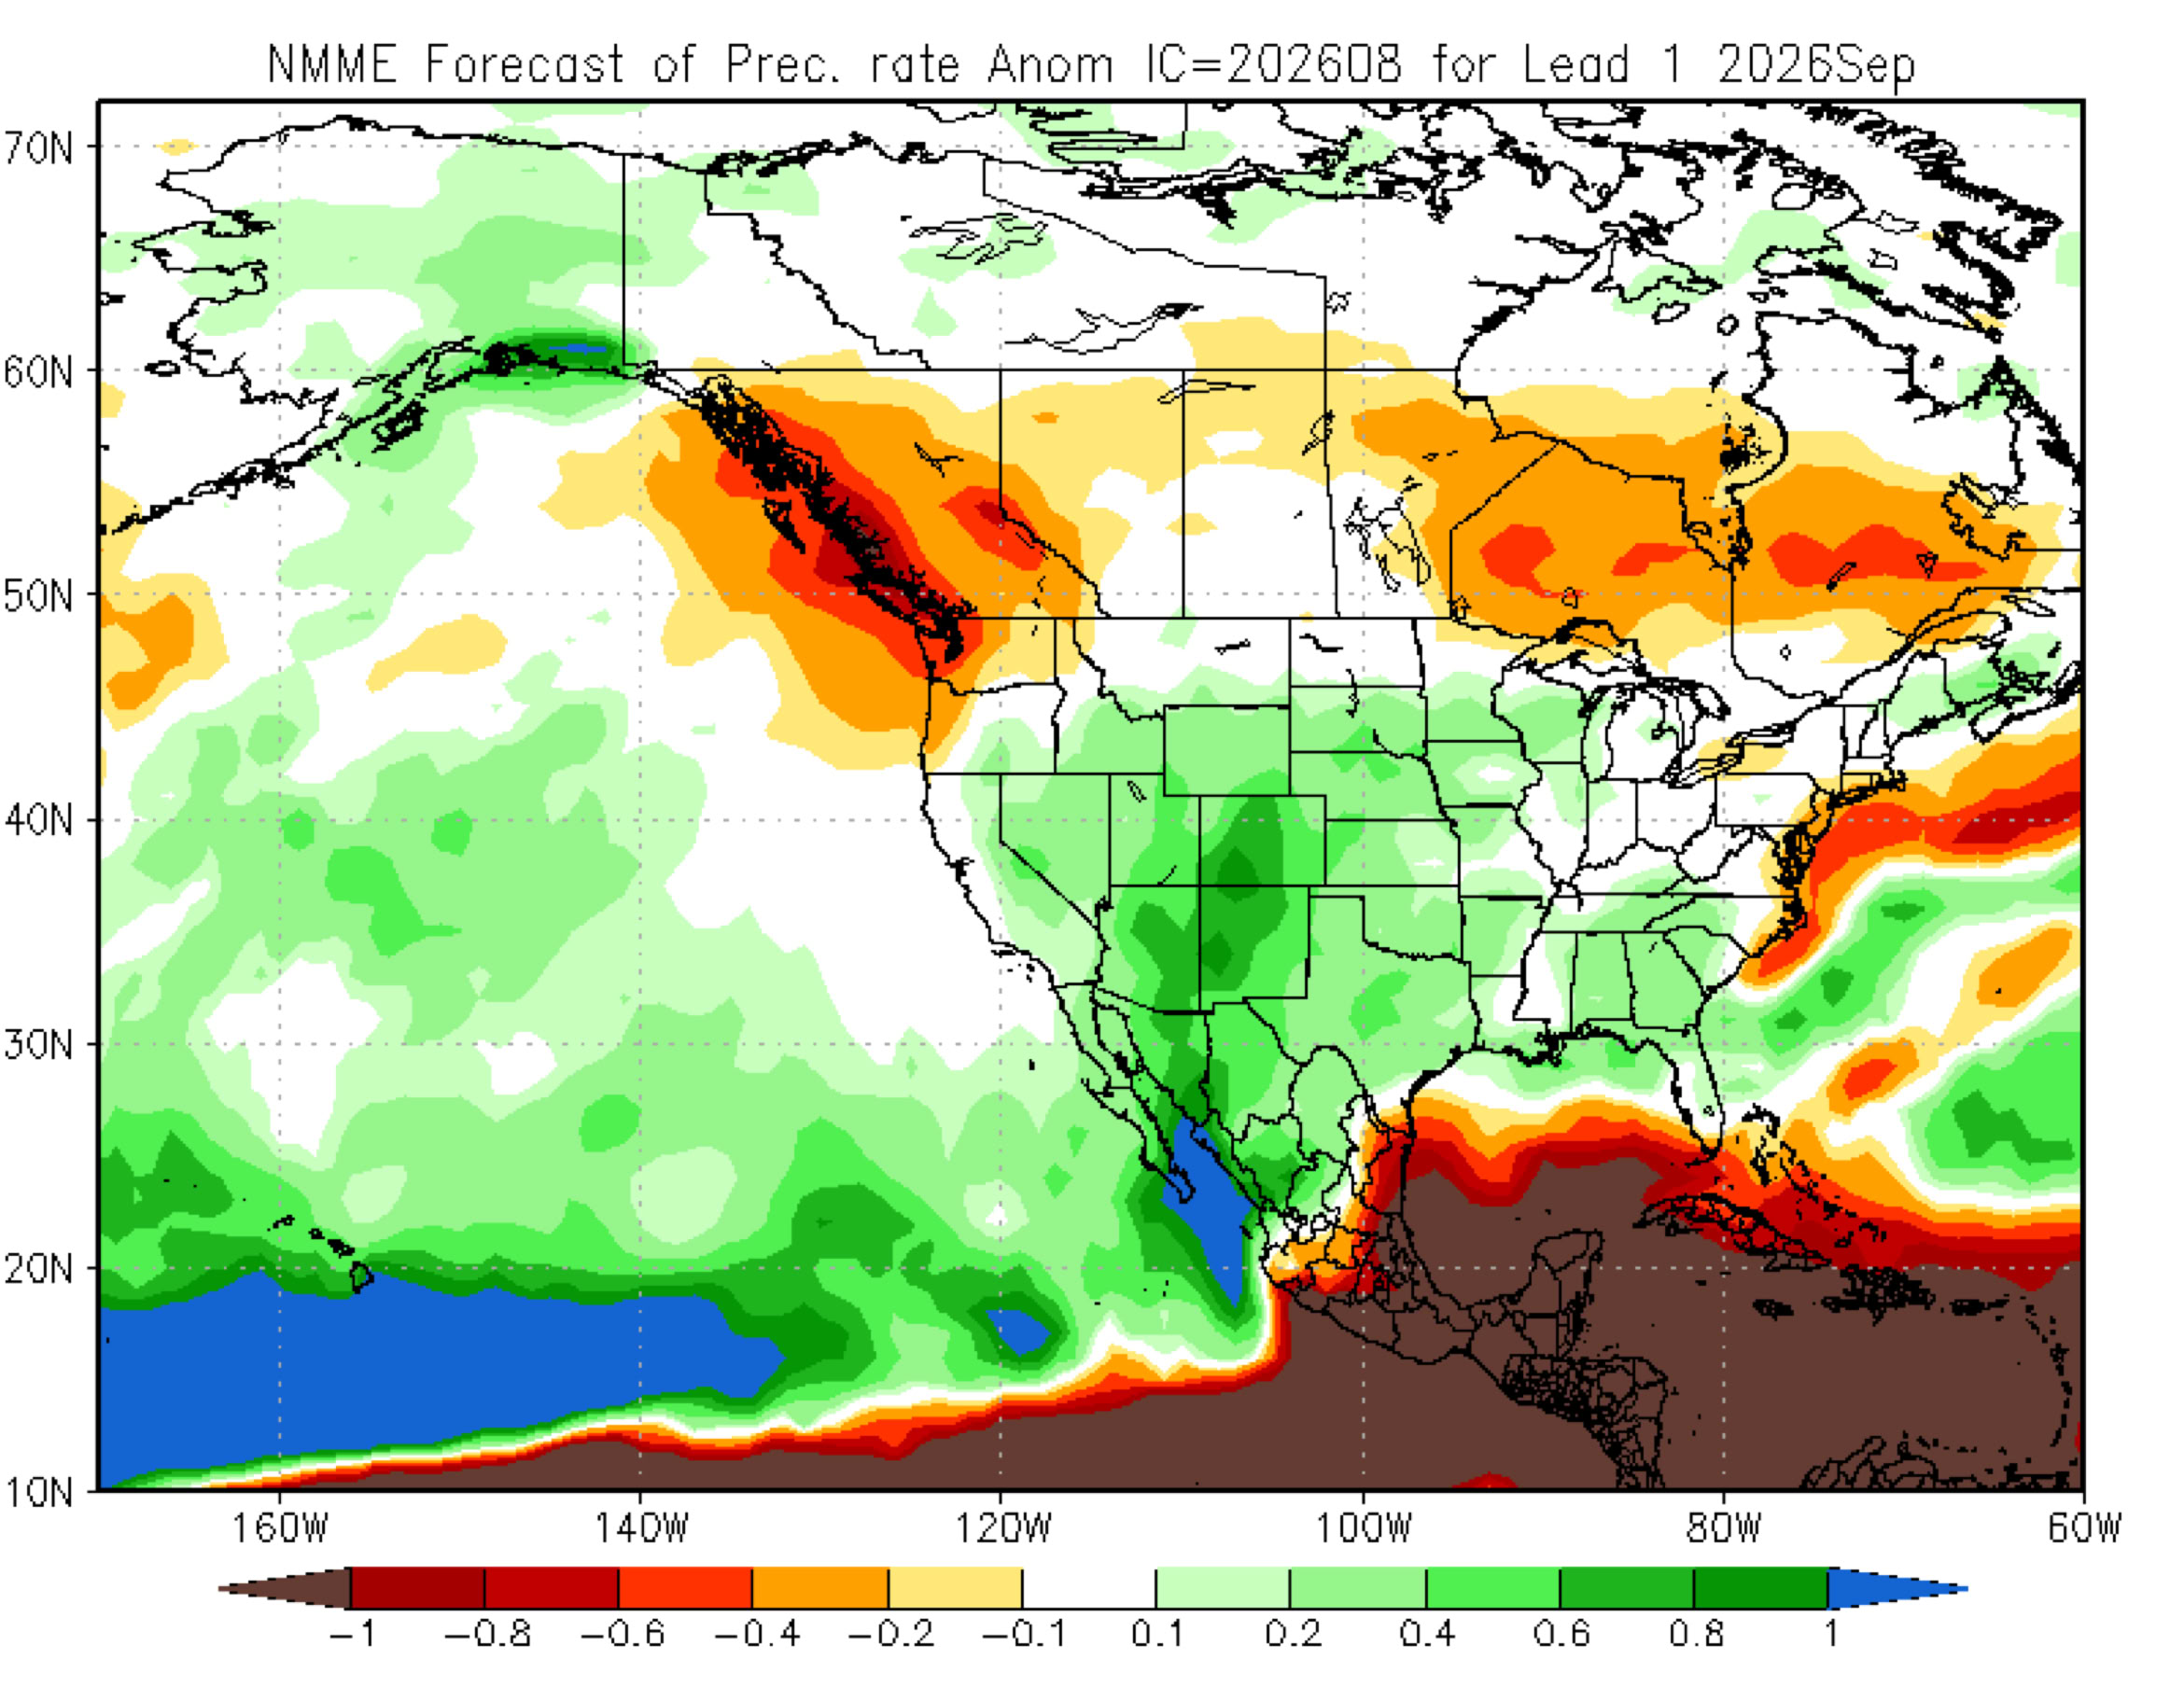
Figure 6 Climate Prediction Center – North American Multi-Model Ensemble precipitation forecast for October 2026. September 2026 model run. Shown is the forecasted precipitation anomaly relative to the 1991 to 2020 thirty-year average.
Figure 7 Climate Prediction Center – North American Multi-Model Ensemble precipitation forecast for November 2027. September 2026 model run. Shown is the forecasted precipitation anomaly relative to the 1991 to 2020 thirty-year average.
Copyright © 2026 Michael Pidwirny