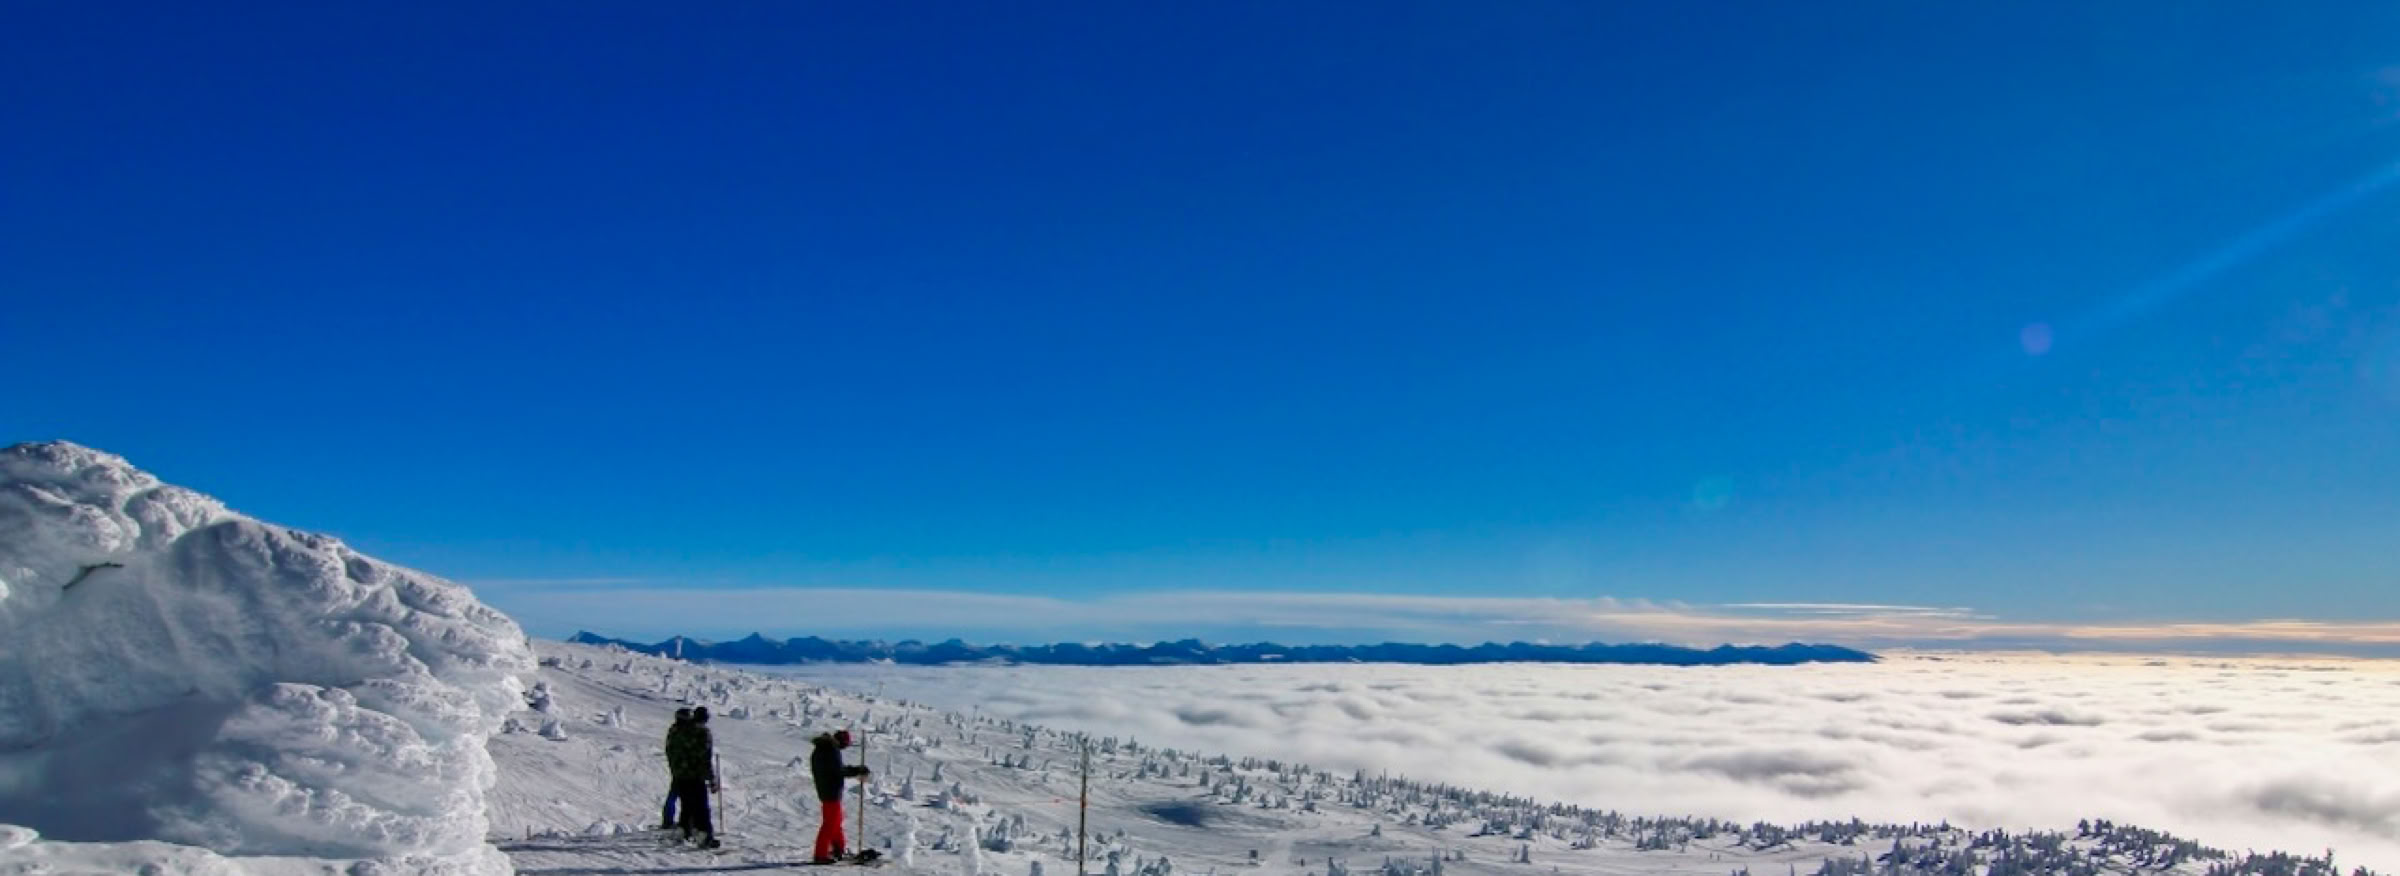
Sunshine Banff
Sunshine Banff

Location and Geography
Sunshine Banff Ski Resort is located at a latitude 51.094167° North and longitude 115.763611° West in the middle of Banff National Park and approximately 15 kilometers southwest of Banff, Alberta. The resort is part of the extensive Rocky Mountain Range that stretches south from northern British Columbia to New Mexico and topographically divides the continent of North America. Sunshine Resort has the highest peak elevation of any ski resort located in Canada (Figure 1). This relatively high elevation along with its distance from the Pacific Ocean gives Sunshine Village a noticeably colder and longer winter ski season when compared to other British Columbian ski resorts west of its location.
Sunshine Village Ski Resort is composed of three adjacent mountains that form an extensive bowl. These peaks include Goats Eye Mountain, Lookout Mountain, and Mount Standish whose respective top elevations reach to 2806, 2730, and 2398 meters above sea level. The village at the resort is found at an elevation of about 1660 meters above sea level. The vertical drop is about 1070 meters from the top of Lookout Mountain (Figure 1). Sunshine Village Ski Resort provides skiers with 1359 hectares of snow-covered terrain in the winter, which is serviced by twelve lifts to provide access to 107 marked runs. There are numerous trails available for skiers of all aptitudes, the majority of which face north.
During the winter months, the resort is frequently under the influence of Continental Polar and Continental Arctic air masses. Winter precipitation is the result of a combination of mid-latitude cyclones and orographic lifting. Table 1 provides monthly statistics for temperature and precipitation for the months of November to April at the ski resort’s mid-elevation.
Climate Indicator Variables
Four indicator variables were generated from ClimateBC to evaluate whether human induced climate change is having an impact on Sunshine Banff Mountain Ski Resort at its mid-elevation 2207 m.
ClimateBC Software – Historic Data
This website uses a high-quality, spatially interpolated climate database program, ClimateBC version 7.70, to compute directly calculated and derived climate variables for the various British Columbian ski resorts based on latitude, longitude, and elevation (Wang et al., 2016 and Wang et al., 2025). Climate databases of this type are very useful for studies in which climate scientists seek to determine the impact of climate change on a particular human socio-economic system. ClimateBC uses numerical downscaling to produce output at the local-scale and has historic datasets for the period 1901 to 2025.
ClimateBC Software – Future Climate Model Forecasts
ClimateBC also includes future simulated climate forecasts for the 21st century (Mahoney et al., 2022). These forecasts are generated by various Coupled Model Intercomparison Project Phase 6 (CMIP6) global climate models (GCMs) used in the Intergovernmental Panel on Climate Change (IPCC) 6th Assessment Reports on climate change. However, ClimateBC contains the output of a subset of 13 of the over 44 global climate models used in the most recent IPCC assessment report. The researchers who developed ClimateBC carefully selected this group to ensure that the forecasts made by these 13 models best replicate the range of results produced by the models used in the latest IPCC reports (Mahoney et al., 2022). The output on this webpage used an ensemble of eight models with an equilibrium climate sensitivity of 3.4°C to create a single averaged forecast. The 13 global climate models available in ClimateBC are shown in Table 2.
Winter Mean Temperature
Winter mean temperatures have steadily increased from 1901 to 2025, with a rate of 0.25°C per decade based on linear regression analysis, as shown in Figure 2. The best-fit regression line predicts an average winter mean temperature of approximately -9.0°C in 2025. Surprisingly, the graph reveals that many of the warmest winters at Sunshine Banff Ski Resort over the last 45 years have been associated with El Niño events.
Figure 3 indicates that winter mean temperatures will continue to increase in the 21st century, reaching -8.2 and -6.3°C, respectively, under the SSP2-4.5 and SSP5-8.5 emission scenarios by 2090.
Winter Degree Days < 0°C
Winter degree days <0°C have steadily decrease from 1901 to 2025, at a rate of 21.4°C per decade, as shown in Figure 4 based on linear regression analysis. The best-fit regression line predicts an average winter degree days of approximately 841°C in 2025.
Figure 5 displays that winter degree days <0°C will continue to decrease in the 21st century, falling to 766 and 616°C, respectively, under the SSP2-4.5 and SSP5-8.5 emission scenarios by 2090.
Winter Snowfall
Winter snowfall has declined from 1901 to 2025, at a rate of 7.3 mm water equivalent per decade, as shown in Figure 6 based on linear regression analysis. This estimate is not statistically significant. The best-fit regression line predicts an average winter snowfall of about 211 mm water equivalent in 2025.
Figure 7 displays that winter snowfall (mm water equivalent) will continue to decrease in the 21st century, dropping to 302 and 285 mm, respectively, under the SSP2-4.5 and SSP5-8.5 emission scenarios by 2090.
Winter Rainfall
Winter rainfall has increased from 1901 to 2025, at a rate of 0.7 mm per decade, as described in Figure 8 based on linear regression analysis. The best-fit regression line predicts an average winter rainfall of about 16 mm water equivalent in 2025.
Figure 9 indicates that winter rainfall (mm) will continue to increase in the 21st century, reaching to 22 and 50 mm, respectively, under the SSP2-4.5 and SSP5-8.5 emission scenarios by 2090.
References
Knutti, R., D. Masson, and A. Gettelman. 2013. Climate model genealogy: Generation CMIP5 and how we got there. Geophysical Research Letters 40, 1194–1199. DOI:10.1002/grl.50256
Mahony, C.R., T. Wang, A. Hamann, and A.J. Cannon. 2022. A CMIP6 ensemble for downscaled monthly climate normals over North America. International Journal of Climatology 42 (11), 5871-5891. DOI:10.1002/joc.7566
Wang, T., A. Hamann, and Z. Sang. 2025. Monthly high‐resolution historical climate data for North America since 1901. International Journal of Climatology 45 (3), e8726. DOI: 10.1002/joc.8726
Wang, T., A. Hamann, D. Spittlehouse, and C. Carroll. 2016. Locally downscaled and spatially customizable climate data for historical and future periods for North America. PLoS ONE 11(6): e0156720. DOI:10.1371/journal.pone.0156720
Table 2 Global climate models available in ClimateBC (version 7.70). * Identifies the climate models available in the eight member ensemble used for the future forecasts shown on this website.

Figure 7 Predicted winter snowfall (mm water equivalent) for the period 2030 to 2090 at Sunshine Banff Ski Resort (elevation 2207 m). These predictions are based on an eight climate model ensemble using the SSP2-4.5 and SSP5-8.5 emission scenarios, as determined from the climate database ClimateBC. Additionally, the figure includes the observed winter snowfall from 1901 to 2025. The orange line is the best-fit linear regression line and the green dash lines show the 5% and 95% prediction thresholds.


Figure 3 Predicted winter mean temperatures (°C) for the period 2030 to 2090 at Sunshine Banff Ski Resort (elevation 2207 m). These predictions are based on an eight climate model ensemble using the SSP2-4.5 and SSP5-8.5 emission scenarios, as derived from the climate database ClimateBC. Additionally, the figure includes the observed winter mean temperatures from 1901 to 2025. The orange line is the best-fit linear regression line and the green dash lines show the 5% and 95% prediction thresholds.


Figure 8 Yearly observations of winter rainfall (mm) from 1901 to 2025 at Sunshine Banff Ski Resort (elevation 2207 m) as derived from the climate database ClimateBC. The orange line is the best-fit linear regression line and the green dash lines show the 5% and 95% prediction thresholds.
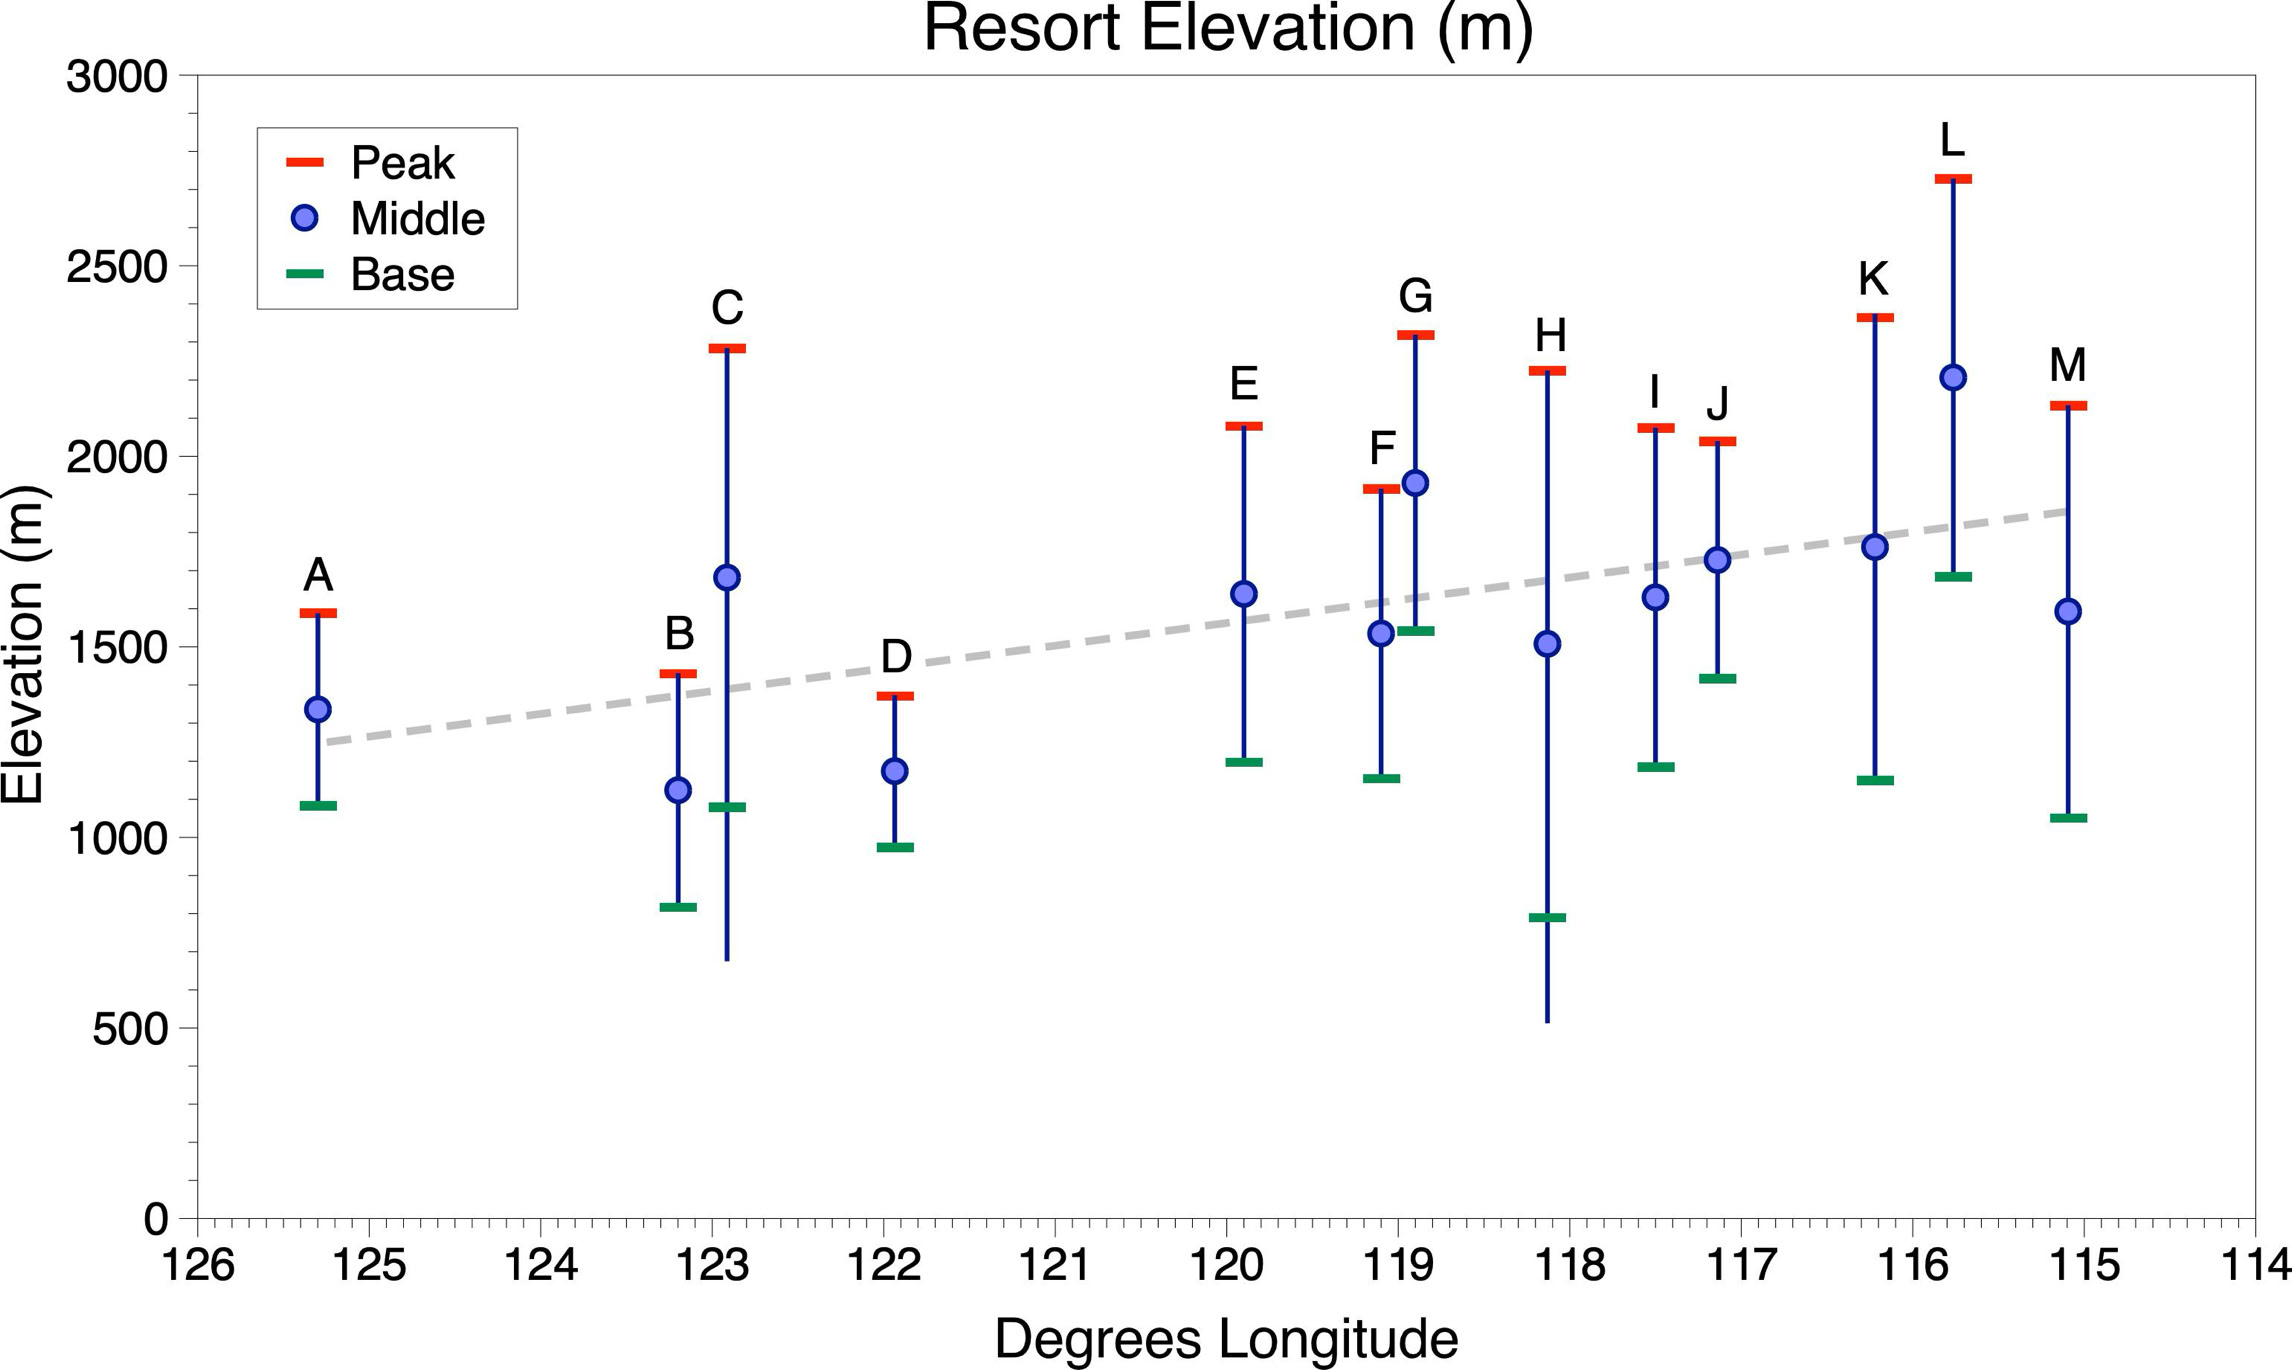
Figure 1 Base, middle, and peak elevations of the British Columbian ski resorts discussed on this website. The ski resorts are ordered along the X-axis based on their longitude. The resorts are labeled as follows: A = Mount Washington, B = Cypress Mountain, C = Whistler Blackcomb, D = Sasquatch Mountain, E = Sun Peaks, F = Silver Star, G = Big White, H = Revelstoke Mountain, I = Red Mountain, J = Whitewater Mountain, K = Panorama, L = Sunshine Banff, and M = Fernie. The grey dotted line represents the average height of the ski resorts, measured by linear regression from west to east. Note that the base elevation for Whistler Blackcomb and Revelstoke Mountain is considered to be at the top of their Gondola lifts, which are located at roughly 1080 meters and 790 meters, respectively, rather than the village elevation.
Table 1 Average monthly values of selected climate variables for Sunshine Banff Mountain Ski Resort at an elevation of 2207 meters. Data is derived for the period of 1991 to 2020 as determined by ClimateBC (version 7.70).
Figure 2 Yearly observations of winter mean temperatures (°C) from 1901 to 2025 at Sunshine Banff Ski Resort (elevation 2207 m) as derived from the climate database ClimateBC. The orange line is the best-fit linear regression line and the green dash lines show the 5% and 95% prediction thresholds.
Figure 4 Yearly observations of winter degree days <0°C from 1901 to 2025 at Sunshine Banff Ski Resort (elevation 2207 m) as derived from the climate database ClimateBC. The orange line is the best-fit linear regression line and the green dash lines show the 5% and 95% prediction thresholds.
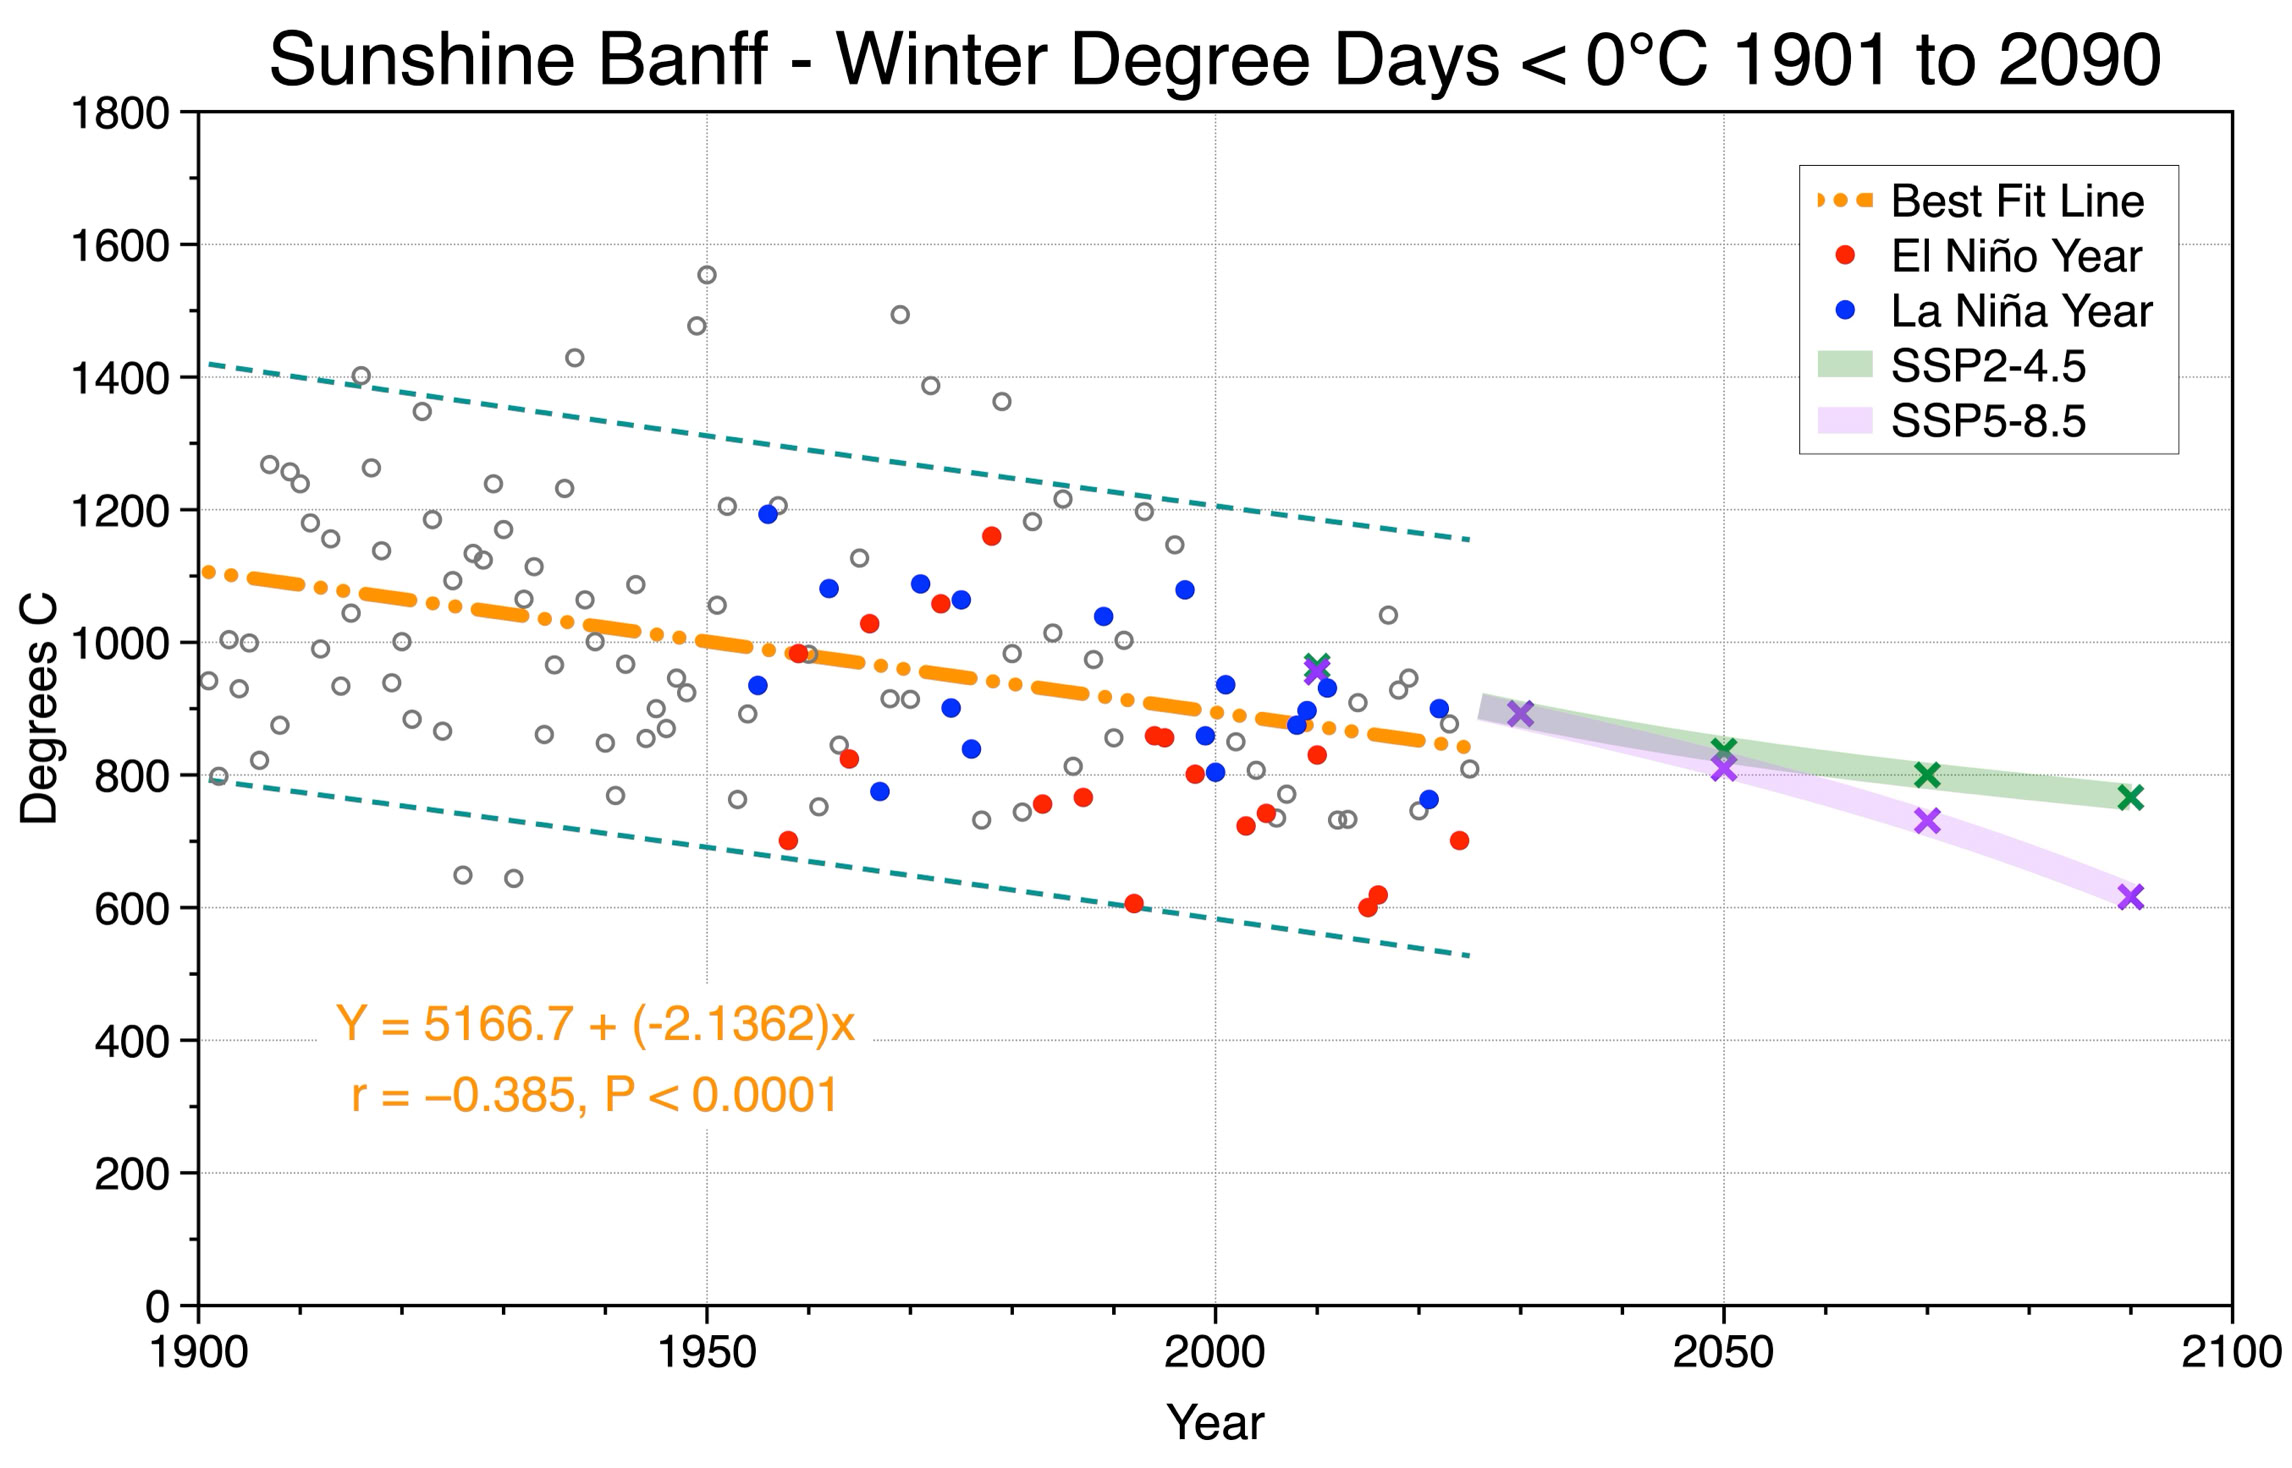
Figure 5 Predicted winter degree days <0°C for the period 2030 to 2090 at Sunshine Banff Ski Resort (elevation 2207 m). These predictions are based on an eight climate model ensemble using the SSP2-4.5 and SSP5-8.5 emission scenarios, as determined from the climate database ClimateBC. Additionally, the figure includes the observed winter degree days <0°C from 1901 to 2025. The orange line is the best-fit linear regression line and the green dash lines show the 5% and 95% prediction thresholds.

Figure 6 Yearly observations of winter snowfall (mm water equivalent) from 1901 to 2025 at Sunshine Banff Ski Resort (elevation 2207 m) as derived from the climate database ClimateBC. The orange line is the best-fit linear regression line and the green dash lines show the 5% and 95% prediction thresholds.


Figure 9 Predicted winter rainfall (mm) for the period 2030 to 2090 at Sunshine Banff Ski Resort (elevation 2207 m). These predictions are based on an eight climate model ensemble using the SSP2-4.5 and SSP5-8.5 emission scenarios, as determined from the climate database ClimateBC. Additionally, the figure includes the observed winter rainfall from 1901 to 2025. The orange line is the best-fit linear regression line and the green dash lines show the 5% and 95% prediction thresholds.
Copyright © 2026 Michael Pidwirny