Southern Oscillation
El Niño - La Niña
Southern Oscillation
El Niño - La Niña

Figure 5 Global surface temperature effects of El Niño from December to February. This map shows the average temperature anomaly for 14 significant El Niño events (1958, 1966, 1973, 1978, 1983, 1987, 1992, 1998, 2003, 2010, 2015, 2016, 2019, and 2024) relative to the 30-year average 1991-2020. Image Copyright: Michael Pidwirny.
El Niño is the name given to the occasional development of warm ocean surface waters along the coast of Ecuador and Peru. When this warming occurs, the usual upwelling of cold, nutrient-rich deep ocean water is significantly reduced. El Niño typically occurs around Christmas and usually lasts a few weeks to a few months. Sometimes an extremely warm event can develop that lasts for much longer periods. A lengthy El Niño can last for up to 2 years.
The formation of an El Niño is linked with the cycles of a Pacific Ocean atmospheric circulation pattern known as the Southern Oscillation. In a typical year, a surface low-pressure system develops in northern Australia and Indonesia, and a high-pressure system over the coast of Peru (Figure 1). As a result, the trade winds over the Pacific Ocean move at a moderate speed from east to west. The trade winds' easterly flow carries warm surface waters westward along the equator, which often leads to frequent convective thunderstorms over Indonesia and coastal Australia. Along the coast of Peru, cold bottom-ocean water rises to the surface to replace the warm water pushed westward by the trade winds.
In an El Niño year, a significant drop in air pressure occurs over a vast region of the central Pacific and along the coast of South America (as depicted in Figure 2). This shift replaces the usual low-pressure system with a weak high-pressure system in the western Pacific, known as the Southern Oscillation. Consequently, the speed of the trade winds is significantly reduced. This reduction allows the equatorial counter-current, which flows from west to east, to strengthen and generate a pulse of warm ocean water that reaches the coastlines of Peru and Ecuador (as shown in Figure 2). This accumulation of warm water causes the eastward movement of the thermocline, which disrupts the upwelling of cold deep-ocean water along the coast of Peru. Climatically, the development of an El Niño brings drought to the western Pacific, heavy rainfall to the equatorial coast of South America, and convective storms and hurricanes to the central Pacific.
Intense El Niño events occur roughly every 8 to 12 years (Figure 3). Since 1935, particularly strong El Niños have developed in 1958, 1966, 1973, 1978, 1983, 1987, 1992, 1998, 2003, 2010, 2015, 2016, 2019, and 2024. In the early 1980s, the first of two intense events developed. The El Niño of 1982-83 brought extreme warming to the equatorial Pacific. Surface sea temperatures in some regions of the Pacific Ocean increased by 6° Celsius above normal. The warmer waters had a devastating effect on marine life off the coast of Peru and Ecuador. Fish catches off the coast of South America were 50% lower than the previous year. The 1982-83 El Niño also had a pronounced influence on the weather in the equatorial Pacific region and worldwide. Severe droughts occurred in Australia, Indonesia, India, and southern Africa. Dry conditions in Australia caused a $2 billion loss in crops, and millions of sheep and cattle died from a lack of water. Unusually heavy rains were experienced in California, Ecuador, and the Gulf of Mexico, leading to increased flooding, landslides, and mudslides. Figure 4 and 5 describe some of the common climatic effects during the winter season associated with the development of a significant El Niño event.
After an El Niño event, weather conditions usually return to normal, or they can change into a condition known as La Niña. La Niña forms when the trade winds become very strong, leading to an unusual accumulation of cold water along the equator in the central and eastern Pacific Ocean (Figure 6). Strong La Niñas have occurred in 1951, 1955, 1971, 1974, 1976, 1989, 1999, 2000, 2008, 2011, and 2021-23 (Figure 3). Figure 7 and 8 describe some of the common global climate effects during the winter season associated with the development of a La Niña event.
An extreme La Niña event developed in the middle of 1998 and was persistent until the winter of 2000. During this period, the Atlantic Ocean saw very active hurricane seasons in 1998 and 1999. In 1998, ten tropical storms developed, of which six became full-blown hurricanes. One of the hurricanes that developed, named Mitch, was the strongest October hurricane ever recorded in 100 years of record-keeping. Some of the other weather anomalies caused by the La Niña event include abnormally heavy summer monsoon rains in India and Southeast Asia, cool and wet winter weather in southeastern Africa, wet weather in north and eastern Australia, cold winter in western Canada and the northwestern United States, winter drought in the southeastern United States, and warm and wet weather in the northeastern United States and southeastern Canada.
For the current El Niño / La Niña forecast see the following websites:
NOAA - EL NIÑO/SOUTHERN OSCILLATION (ENSO) DIAGNOSTIC DISCUSSION
NOAA - ENSO: Recent Evolution, Current Status and Predictions
Australian Government, Bureau of Meteorology - Southern Hemisphere Monitoring
The Columbia Climate School, Columbia University - ENSO Forecast

Figure 1 This cross-section of the Pacific Ocean, along the equator, illustrates the pattern of atmospheric circulation typically found in the equatorial Pacific. Note the cold water upwelling, the position of the thermocline, and the formation of the warm equatorial ocean current in this event. Image Copyright: Michael Pidwirny.
Figure 4 Common Northern Hemisphere winter (December to February) climate effects with the development of an El Niño event. Image Source: NOAA - National Weather Service.
Figure 8 Global surface temperature effects of La Niña from December to February. This map shows the average temperature anomaly for 13 significant La Niña events (1951, 1955, 1971, 1974, 1976, 1989, 1999, 2000, 2008, 2011, 2021, 2022, and 2023) relative to the 30-year average 1991-2020. Image Copyright: Michael Pidwirny.

Figure 2 This cross-section of the Pacific Ocean, along the equator, illustrates the pattern of atmospheric circulation that causes the formation of El Niño. Note how the cold water upwelling is reduced, the position of the thermocline moves eastward, and how the warm equatorial ocean current switches direction. Image Copyright: Michael Pidwirny.
Figure 3 The relative severity of El Niño and La Niña events between January 1930 and March 2025 based on the Southern Oscillation Index. This graph identifies some of the strongest El Niño and La Niña events that occurred after 1930. Image Copyright: Michael Pidwirny.


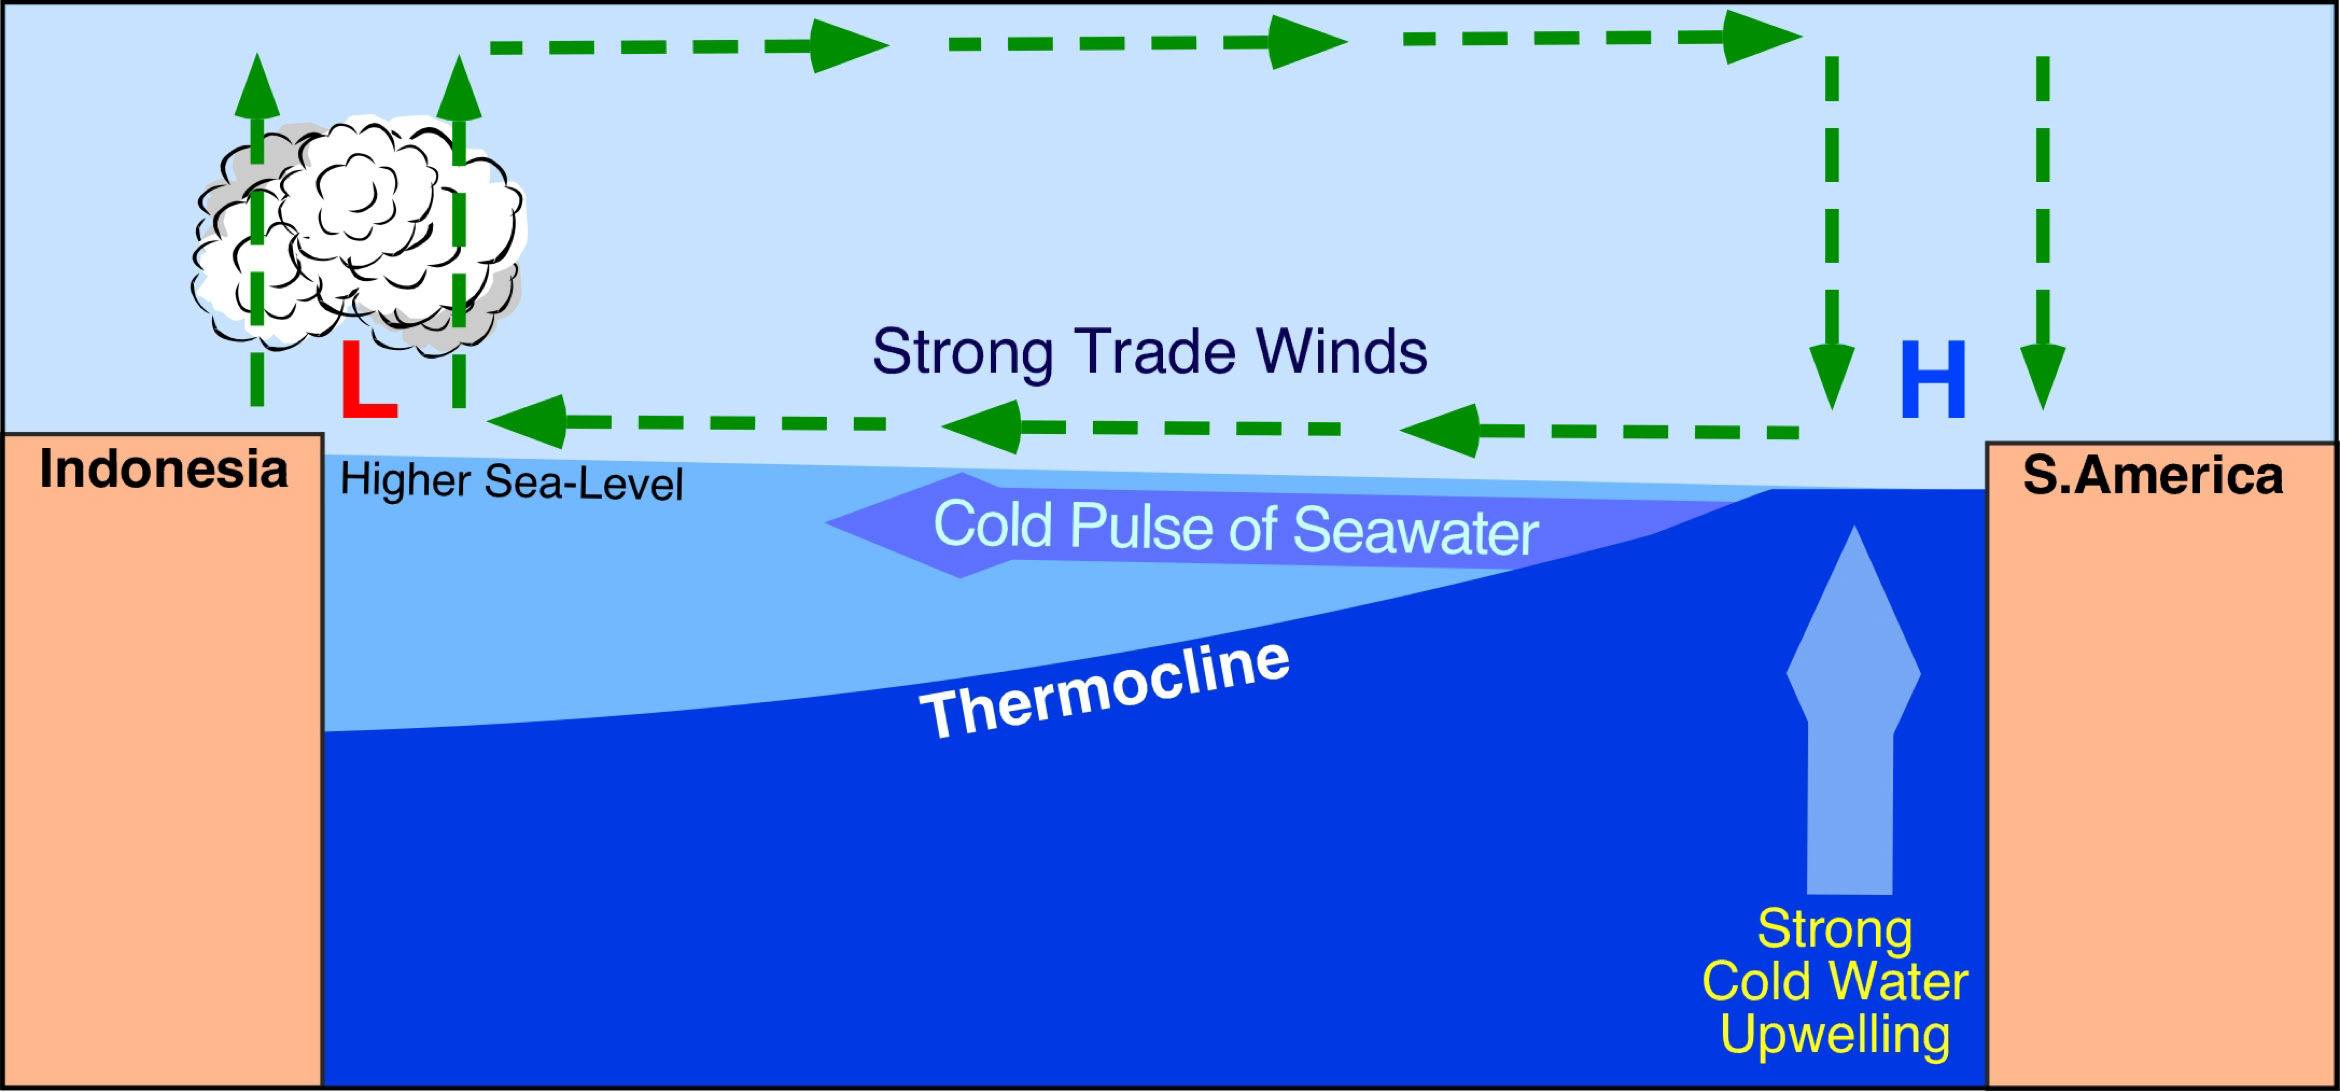
Figure 6 This cross-section of the Pacific Ocean, along the equator, illustrates the atmospheric circulation pattern that causes La Niña's formation. Note how the cold water upwelling has intensified, the position of the thermocline has moved westward, and how the equatorial ocean current is now cold (compare with Figure 2). Image Copyright: Michael Pidwirny.

Figure 7 Common Northern Hemisphere winter (December to February) climate effects with the development of a La Niña event. Image Source: NOAA - National Weather Service.

Copyright © 2026 Michael Pidwirny