Whistler Blackcomb
Weather Station Data
Whistler Blackcomb
Weather Station Data
Whistler Blackcomb is a premier ski resort in Canada, attracting approximately 2 million visitors annually, and is about a two-hour drive from Vancouver, British Columbia. Whistler Blackcomb has approximately 3,300 hectares of skiable terrain, a peak elevation of 2,240 meters, and a vertical drop of approximately 1,565 meters. Located at the ski resort are two weather stations: one at 659 meters (the resort Village) and a second at 1,835 meters (Roundhouse Lodge). These weather stations have been collecting daily data on air temperature, snowfall, rainfall, and ground snow depth since the 1970s. The following list describes the climate variables analyzed in this study:
Winter Minimum Temperature - for each year, the minimum temperature recorded for each day in December (previous year), January, and February was summed and then divided by the total number of days in those months.
Winter Maximum Temperature - for each year, the maximum temperature recorded for each day in December (previous year), January, and February was summed and then divided by the total number of days in those months.
Winter Snowfall - for each year, the snow recorded for each day in December (previous year), January, and February summed.
Winter Rainfall - for each year, the rain recorded for each day in December (previous year), January, and February summed.
Snow Depth Percentage – an average for the period 1981 to 2010 of snow depth for each day in December (previous year), January, and February was calculated. Then, the snow depth percentage for the winter season (December of the previous year, January, and February) for a particular year was determined by dividing each daily measurement by the 1981 to 2010 average. These values were then summed and divided by the number of days in that winter season.
The Village weather station data record spans from 1977 to 2026. At this weather station, minimum temperatures, averaged for the winter season (December, January, and February), are rising almost four times faster than maximum temperatures, 0.49 vs 0.14°C per decade (Figures 1 and 2). Winter minumum temperatures have increased by 2.4°C from 1977 to 2026 according to the linear regression best-fit line. Winter maximum temperatures have increased by 0.7°C. A proportionally significant number of the warmest winters, as measured by minumum and maximum averaged temperatures, occurred during El Niño events.
Snowfall and rainfall show no noteworthy trends at the Village from 1977 to 2008 (Figures 3 and 4). However, measurements of these two variables were not made from 2009 to 2026. Thus, the data record for these two climate variables is too short to expected trends because due to the increase in air temperatures observed since 1977. We should see proportionally less snowfall and more rainfall occurring at Whistler Blackcomb’s Village.
Ground snow depth during the winter season as measured as a percentage of the 1981-2010 average appears to have declined significantly since 2009 (Figure 5). From 1981 to 2010, in the Village, about 40% of the years had a snow depth for the winter season that was less than 75% of the 1981-2010 average. Between 2011 and 2026, the percentage of years with snow depths below 75% increased significantly, reaching 64%.
The Roundhouse Lodge weather station data record spans from 1974 to 2026. At this location, winter season (December, January, and February) minimum temperatures are also rising faster than maximum temperatures, 0.26 vs 0.16°C per decade (Figures 6 and 7). Yesars with above-average minimum and maximum winter season temperatures are often associated with El Niño events. La Nina events usually cause minimum and maximum winter season temperatures to be below-average.
No meaningful change in snowfall was observed at Roundhouse Lodge from 1974 to 2026 (Figure 8). During this period snowfall average about 566 cm and ranged from about 250 cm in 1977 to 1090 cm in 1999.
Winter rainfall has increased considerably since the early 2000s (Figure 9). From 1974 to 2000, only 3 out of 27 years (11%) had more than 60 mm of rain during the winter season. In the next 26 years (2001 to 2026), 12 years (46%) had more 60 mm of rain. These rain-on-snow events significantly reduce the surface quality of ski runs, making them sticky, rutted, and icy. Finally, in the last 25 years, winters with high rainfall amounts appear to be related to El Niño events.
Ground snow depth, measured as a percentage of the 1981-2010 average at Roundhouse, appears to show no discernible trend (Figure 10). Data from Roundhouse suggests that years with lower than average 100% winter season snow depth (relative to the 1981-2010 average) since the year 2000 were often caused by low snowfall, high rainfall, and above-normal temperatures, or a combination of these factors.
Finally, a stochastic weather generator (LARSWG-8.0), combined with an eight-member AR6 climate model ensemble (with an Equilibrium Climate Sensitivity of 3.2°C - See Table 1) and the emission scenarios SSP2-4.5 and SSP5-8.5, were used to predict how daily minimum and maximum temperatures averaged over the winter season will change from 2030 to 2090 at the two weather station locations.
Figure 11 illustrates that winter minimum temperatures at Whistler Blackcomb Village are forecasted to continue to rise in the 21st century under the SSP2-4.5 and SSP5-8.5 emission scenarios by 2090. The rate of temperature increase from 2030 to 2090 for the SSP2-4.5 scenario is projected to be 0.35°C per decade, resulting in a winter minimum temperature of -1.6°C by 2090. In contrast, the SSP5-8.5 scenario predicts a faster rate of increase, with a 0.60°C per decade rise from 2030 to 2090, leading to a winter minimum temperature of -0.1°C at the end of this period.
The climate model ensemble predicts that winter maximum temperatures will also continue to increase at the Village between 2030 to 2090 (Figure 12). The rate of winter maximum temperature increase for the SSP2-4.5 emission scenario will be 0.31°C per decade reaching a winter maximum temperature of 4.4°C in 2090. The SSP5-8.5 scenario predicts a faster rate of increase, with a 0.54°C per decade rise from 2030 to 2090, leading to a winter maximum temperature of 5.8°C at the end of this period.
Figure 13 indicates that winter minimum temperatures at Whistler Blackcomb Roundhouse Lodge will continue to increase in the 21st century, reaching -4.8 and -3.4°C, respectively, under the SSP2-4.5 and SSP5-8.5 emission scenarios by 2090. The rate of increase under SSP2-4.5 between 2030 and 2090 will be 0.34°C per decade. For the SSP5-8.5 emission scenario maximum temperatures will at a rate of 0.60°C per decade.
The climate model ensemble predicts that winter maximum temperatures at the Roundhouse Lodge will continue to rise between 2030 and 2090 (Figure 14). Under the SSP2-4.5 emission scenario, the rate of increase will be 0.31°C per decade, resulting in a winter maximum temperature of 1.2°C by 2090. The SSP5-8.5 scenario predicts a faster rate of increase, with a 0.54°C per decade rise from 2030 to 2090, leading to a winter maximum temperature of 2.6°C at the end of this period.
Conclusions
Whistler Blackcomb’s weather station record shows that winters have warmed up substantially since the 1970s, especially overnight lows, with the warmest winters often linked to El Niño events. This warming is already significantly affecting snow conditions at lower elevations and is projected to continue through 2090, increasing the likelihood of rain events, rather than snow, and a continued reduction in overall snow reliability.
The observations and forecasts point to a clear trajectory: continued winter warming will progressively shift Whistler Blackcomb toward more variable, rain-impacted winters—especially at lower elevations—while higher elevations may retain more snowfall, it will still face growing impacts from increased winter rain and associated ski run surface degradation (Figure 15).

Figure 1 Yearly observations of winter minimum temperatures (°C) from 1977 to 2026 as measured at Whistler Blackcomb’s Village weather station. The orange line is the best-fit linear regression line and the green dash lines show the 5% and 95% prediction thresholds.

Figure 2 Yearly observations of winter maximum temperatures (°C) from 1977 to 2026 as measured at Whistler Blackcomb’s Village weather station. The orange line is the best-fit linear regression line and the green dash lines show the 5% and 95% prediction thresholds.

Figure 3 Yearly observations of winter snowfall (cm) from 1977 to 2009 as measured at Whistler Blackcomb’s Village weather station. The orange line represents the average of the 31 observations, which is 271 centimeters.

Figure 4 Yearly observations of winter rainfall (mm) from 1977 to 2009 as measured at Whistler Blackcomb’s Village weather station. The orange line represents the average of the 31 observations, which amounted to 184 millimeters.
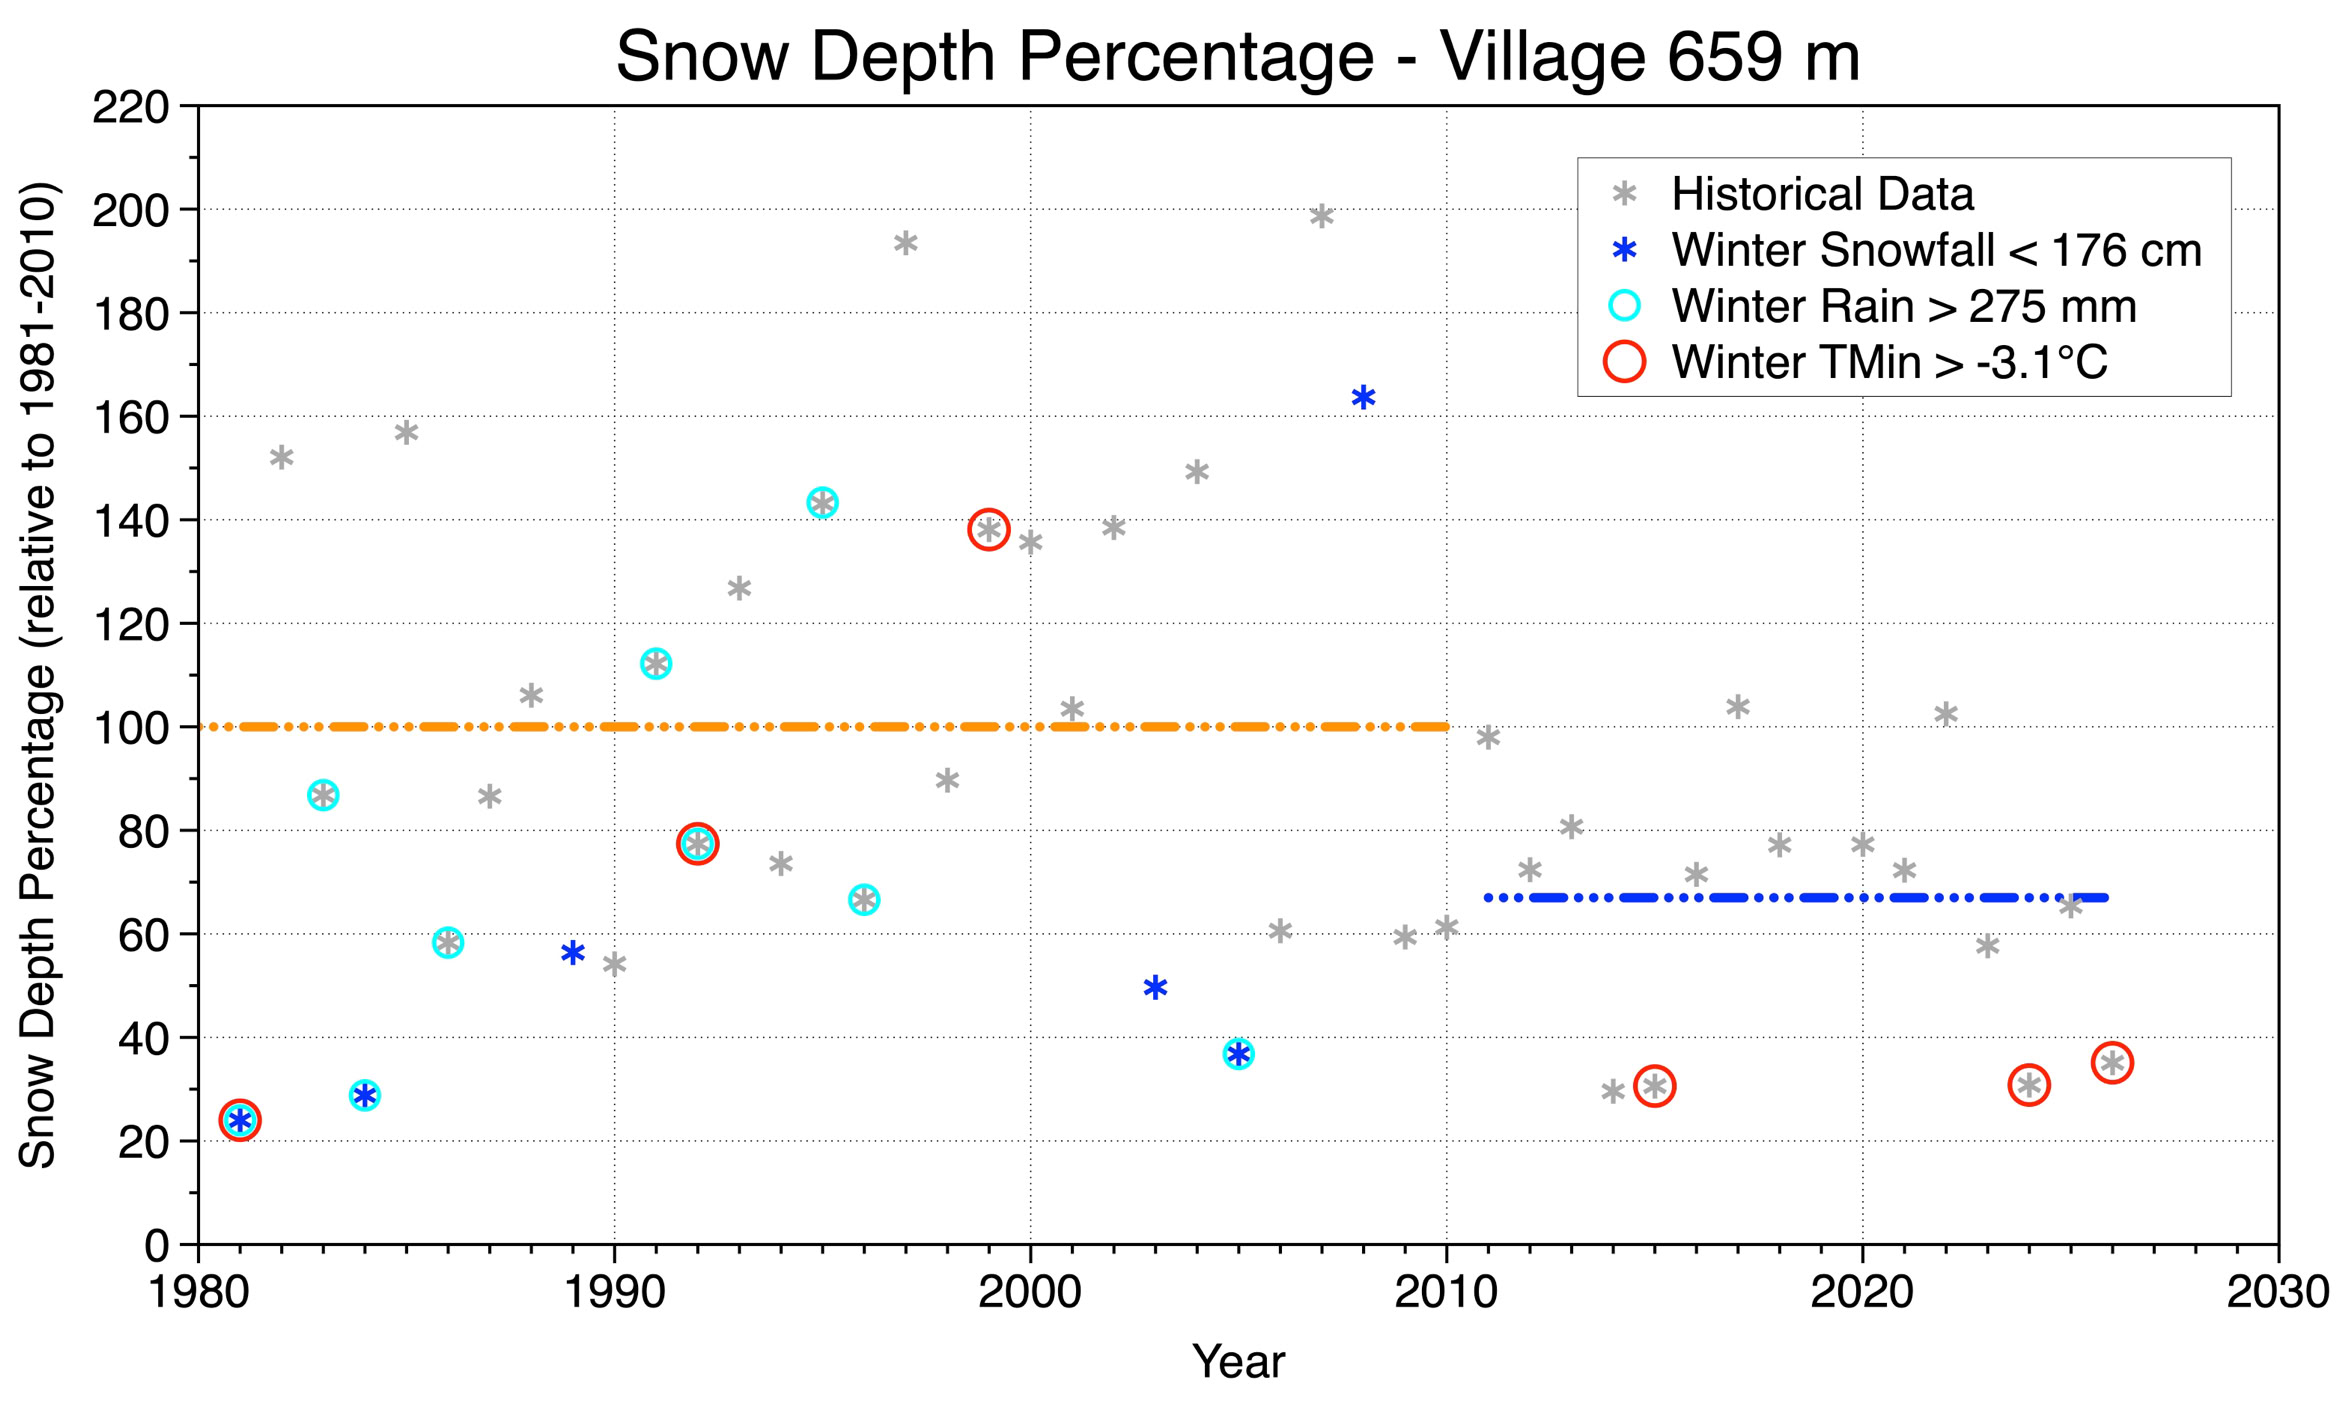
Figure 5 Yearly observations of ground snow depth (measure as a percentage of the 1981 to 2010 average - orange line) from 1981 to 2026 as measured at Whistler Blackcomb’s Village weather station. Between 2011 to 2026 average snow depth measured only 67% (blue line).

Figure 6 Yearly observations of winter minimum temperatures (°C) from 1974 to 2026 as measured at Whistler Blackcomb’s Roundhouse weather station. The orange line is the best-fit linear regression line and the green dash lines show the 5% and 95% prediction thresholds.

Figure 7 Yearly observations of winter maximum temperatures (°C) from 1974 to 2026 as measured at Whistler Blackcomb’s Roundhouse weather station. The orange line is the best-fit linear regression line and the green dash lines show the 5% and 95% prediction thresholds.

Figure 8 Yearly observations of winter snowfall (cm) from 1974 to 2026 as measured at Whistler Blackcomb’s Roundhouse weather station. The orange line represents the average of the 51 observations, which is 566 centimeters.

Figure 9 Yearly observations of winter rainfall (mm) from 1974 to 2026 as measured at Whistler Blackcomb’s Roundhouse weather station. The blue dotted line the trend in the data as determined by exponential regression.

Figure 10 Yearly observations of ground snow depth (measure as a percentage of the 1981 to 2010 average - orange line) from 1981 to 2026 as measured at Whistler Blackcomb’s Roundhouse weather station.
Table 1 Global climate models used to forecast future near surface air temperatures at Whistler Blackcomb’s Village and Roundhouse locations.
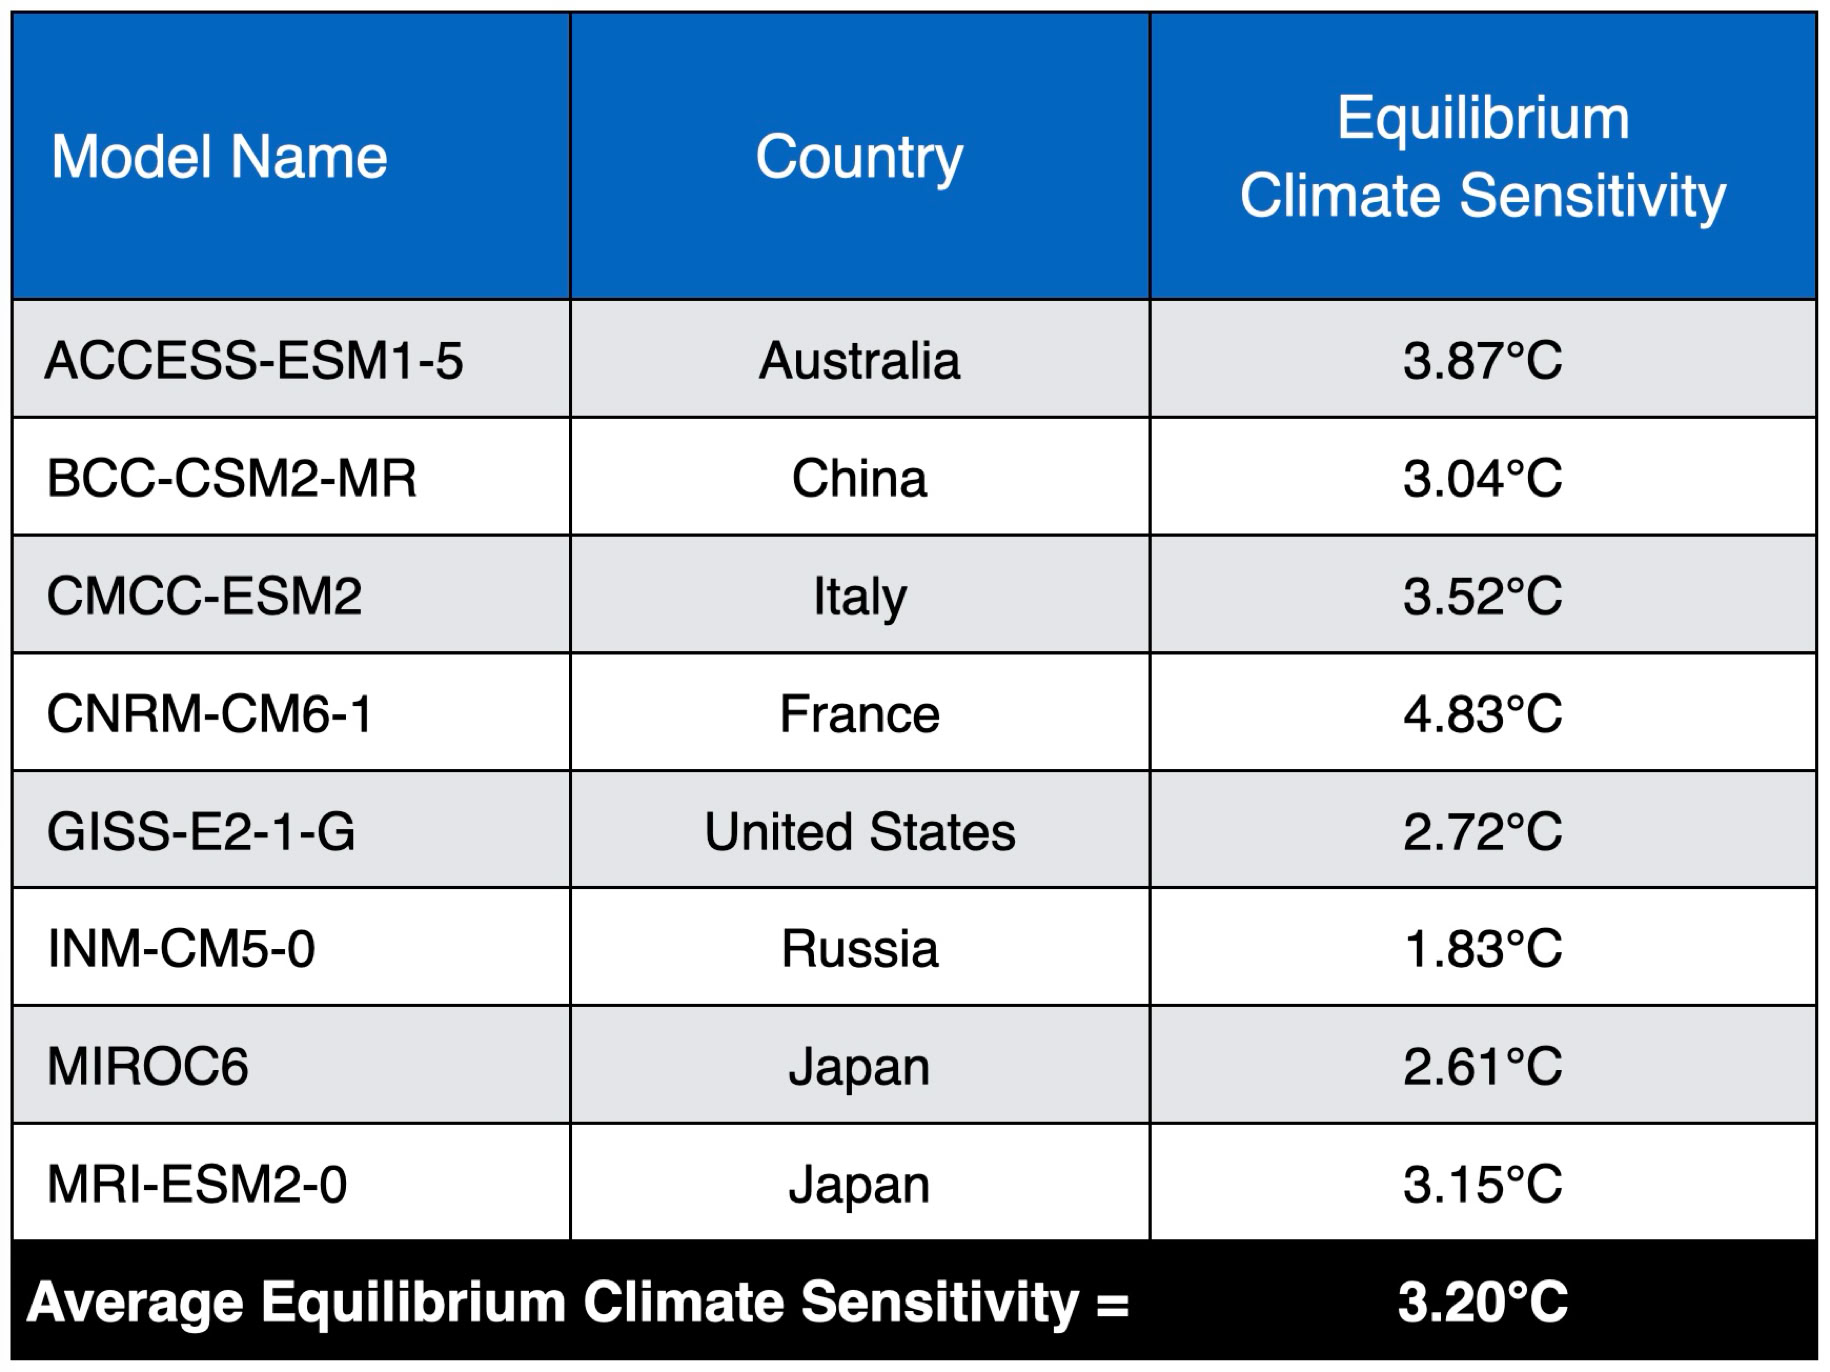

Figure 11 Predicted winter minimum temperatures (°C) for the period 2030 to 2090 at Whistler Blackcomb’s Village location (elevation 659 m). These predictions are based on an eight climate model ensemble using the SSP2-4.5 and SSP5-8.5 emission scenarios, as derived using LARSWG-8.0 weather generator. Additionally, the figure includes the observed winter minimum temperatures from 1977 to 2026. The orange line is the best-fit linear regression line and the green dash lines show the 5% and 95% prediction thresholds.

Figure 12 Predicted winter maximum temperatures (°C) for the period 2030 to 2090 at Whistler Blackcomb’s Village location (elevation 659 m). These predictions are based on an eight climate model ensemble using the SSP2-4.5 and SSP5-8.5 emission scenarios, as derived using LARSWG-8.0 weather generator. Additionally, the figure includes the observed winter minimum temperatures from 1977 to 2026. The orange line is the best-fit linear regression line and the green dash lines show the 5% and 95% prediction thresholds.

Figure 13 Predicted winter minimum temperatures (°C) for the period 2030 to 2090 at Whistler Blackcomb’s Roundhouse location (elevation 1835 m). These predictions are based on an eight climate model ensemble using the SSP2-4.5 and SSP5-8.5 emission scenarios, as derived using LARSWG-8.0 weather generator. Additionally, the figure includes the observed winter minimum temperatures from 1974 to 2026. The orange line is the best-fit linear regression line and the green dash lines show the 5% and 95% prediction thresholds.

Figure 14 Predicted winter maximum temperatures (°C) for the period 2030 to 2090 at Whistler Blackcomb’s Roundhouse location (elevation 1835 m). These predictions are based on an eight climate model ensemble using the SSP2-4.5 and SSP5-8.5 emission scenarios, as derived using LARSWG-8.0 weather generator. Additionally, the figure includes the observed winter minimum temperatures from 1974 to 2026. The orange line is the best-fit linear regression line and the green dash lines show the 5% and 95% prediction thresholds.

Figure 15 The process of how rain-on-snow events cause the degradation of the surface of ski runs.
Copyright © 2026 Michael Pidwirny